The average marketing agency spends 20 to 60 minutes per client per month writing the narrative explanation for a report. Not pulling the data—that part is largely automated. Not formatting the PDF—templates handle most of it. The bottleneck is the middle step: looking at numbers, deciding what matters, and writing the three to five paragraphs that turn a spreadsheet into something a client can actually read.
For a 20-client agency, that is 7 to 20 hours every month. At a conservative billable rate of $150 per hour, that is $2,250 to $4,500 in capacity spent on a task that follows the same pattern every time: pull, interpret, write, format, send.
Conversational analytics does not eliminate reporting. It eliminates the step that makes reporting slow.
The current reporting workflow, step by step
Most agency reporting follows a five-step sequence that has not changed meaningfully in a decade.
Step one: pull the data. Log into Google Ads, GA4, Meta Ads Manager, Search Console. Export the date range. Paste into a spreadsheet or reporting tool. If you use AgencyAnalytics or DashThis, this step is partially automated—but you are still looking at raw numbers that need context.
Step two: interpret. This is the expensive step. Someone senior—usually an account manager or head of performance—looks at the numbers and forms a view. CPA went up. Why? Was it a budget increase, an audience change, a creative fatigue issue, or seasonality? This requires cross-referencing multiple data points and applying judgement.
Step three: write the narrative. Open the report template. Write the executive summary. Explain what happened in each channel. Add recommendations. This is where the 20 to 60 minutes lives. The numbers are already there. The explanation is the work.
Step four: format. Apply the client's branding. Check that the charts render correctly. Make sure the PDF exports cleanly. Adjust margins, fix orphaned headings, resize a logo that shifted during export.
Step five: send. Email the PDF. Maybe upload it to a client portal. Log the delivery. Move to the next client.
Steps one and four have been optimized by existing tools. Steps two and three have not. They remain manual, repetitive, and expensive—because the tools that handle data visualization were never designed to produce explanations.
Where conversational analytics intervenes
Conversational analytics replaces steps two and three entirely. Instead of pulling data into a spreadsheet and writing a narrative around it, you ask a question.
"How did Greenfield Digital perform last month?"
That question becomes a precise query, run against live data from every connected source. The significant changes are identified, the most likely causes determined, and the explanation written—with specific numbers, period-over-period comparisons, and actionable recommendations.
The output is not a chart. It is a paragraph like this:
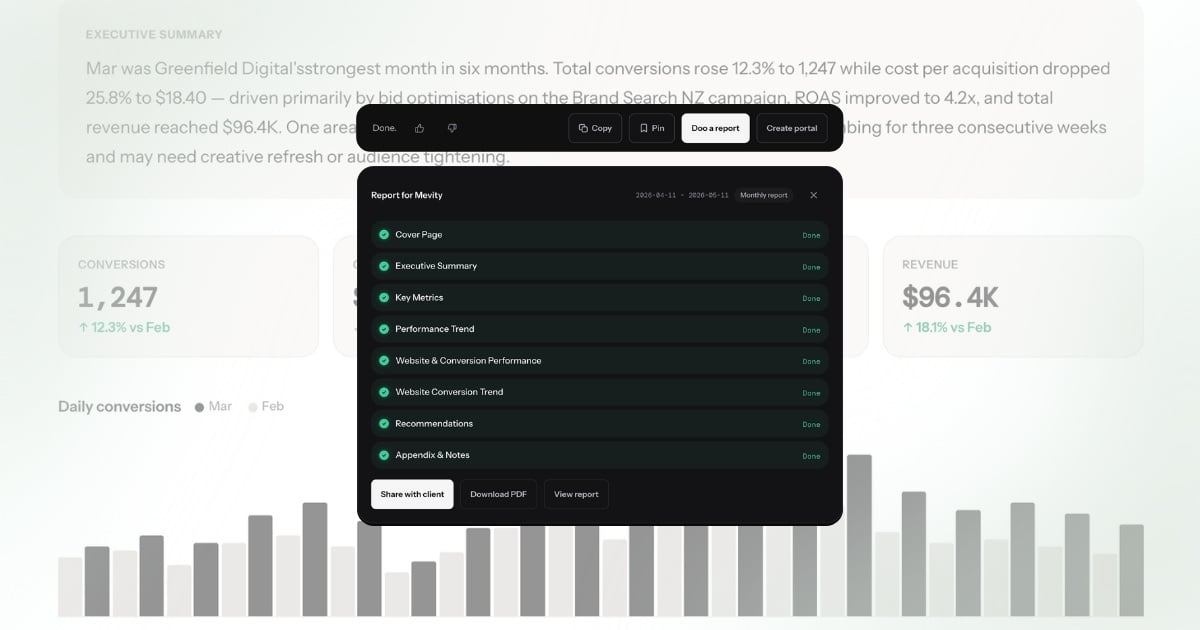
Revenue increased 14% to $87,400, driven by a 22% lift in Google Ads conversion rate following the landing page redesign on March 3rd. CPA dropped from $38.20 to $29.60 across Brand Search campaigns. Meta prospecting spend remained flat but ROAS improved from 2.1x to 2.8x. Recommendation: increase Meta prospecting budget by 15% while the creative is still performing.
That is the executive summary for the report. It took seconds, not an hour. And it is specific enough to send to a client without editing.
Why existing automation does not solve this
Most agencies have already automated parts of the reporting process. If you use AgencyAnalytics, DashThis, or a similar platform, the data pull is handled. Templates apply formatting. Scheduled sends deliver on time. The automation stack for client reporting has improved meaningfully over the past few years.
But automation in the traditional sense means "do the same thing faster." It does not mean "do a different thing." The template still has an empty executive summary field. The campaign performance section still needs someone to write "Brand Search conversions declined 18% following the audience expansion on March 5th." The scheduled delivery sends on time, but what it sends still requires manual assembly.
This is the distinction between workflow automation and output automation. Existing tools automate the workflow around the report—the data pull, the formatting, the delivery. Conversational analytics automates the output itself—the explanation, the analysis, the recommendation. The first saves 10 minutes of data wrangling. The second saves 20-60 minutes of thinking and writing.
For agencies that have already invested in automation tooling and still find reporting takes too long, this is usually where the remaining time lives. The writing step was never automatable before because no tool could look at data and produce a specific, accurate, causal explanation. That capability is what makes conversational analytics a different category, not a better version of the same one.
From question to report in one step
The shift that matters here is not just speed—it is workflow compression. In a conversational analytics platform, the report is a downstream output of the answer, not a separate process.
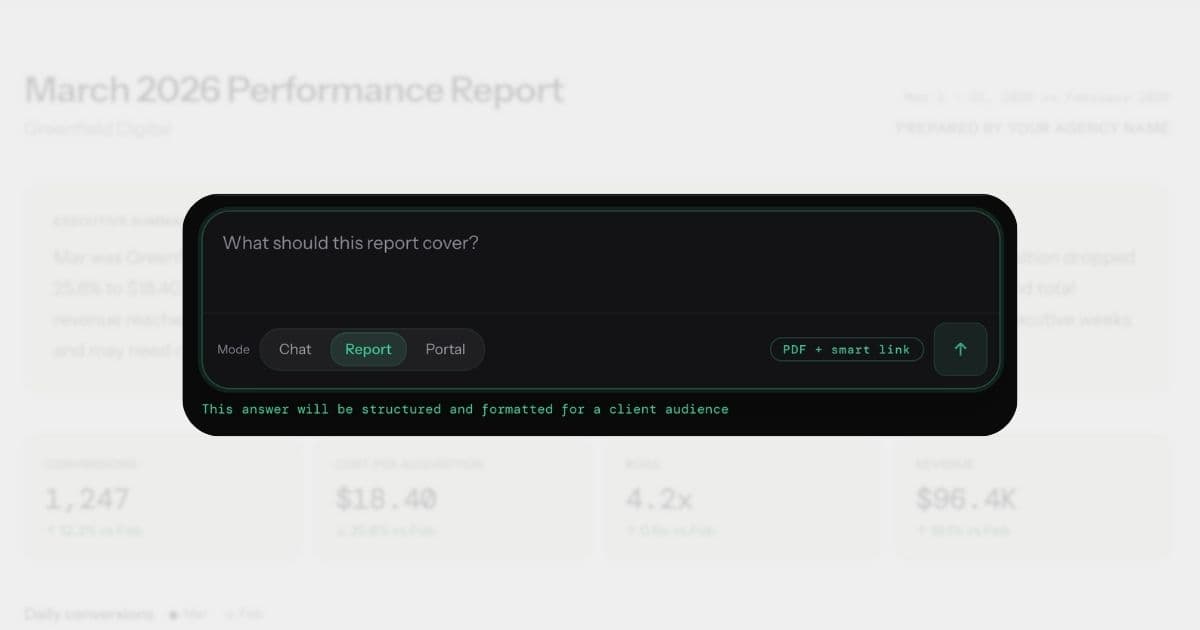
The sequence works like this: you ask a question about a client's performance. You get back an answer with metrics, trends, and recommendations. From that answer, you generate a branded report—cover page, KPI summary, channel breakdowns, campaign tables, AI-written recommendations—in a single action.
There is no separate report builder. No drag-and-drop template editor. No widget configuration screen. The answer is the content. The report is just the container. This is what one-click reporting actually means — not a faster template, but a complete report assembled from an answer that already contains the analysis.
This is fundamentally different from how existing reporting tools work. AgencyAnalytics and DashThis start with the container—a template with empty slots—and require you to fill those slots with data and then write the narrative yourself. Conversational analytics starts with the answer and wraps the report around it.
What the output actually looks like
A generated report from a conversational analytics platform includes several sections that would normally take an hour to assemble manually.
Executive summary. An AI-written narrative that identifies the most significant changes, explains their causes, and states implications. Not a bullet list of metrics—a coherent paragraph that reads like it was written by the account manager.
KPI overview. Key metrics with period-over-period comparison. Revenue, spend, CPA, ROAS, conversion rate—each with the actual number, the change, and directional context. Metrics where "down is good" (CPA, CPC, bounce rate) are colour-coded correctly: green when they drop, red when they rise.
Channel breakdowns. Per-platform cards showing Google Ads, Meta, GA4, and Search Console performance individually. Each with its own narrative, not just numbers.
Campaign performance. A table with every active campaign, its spend, conversions, CPA, and status. Sortable, filterable, and annotated with AI-generated status indicators.
Recommendations. Prioritised actions grounded in the actual data—"Increase Brand Search budget by 20%" rather than "Consider reviewing your campaign performance." Each recommendation cites the specific numbers that support it.
The entire report is generated in under 60 seconds. For context, the manual version of this same output takes most agencies 20 to 60 minutes per client.
The same client, two workflows
To make the difference concrete, consider the same client situation handled both ways.
The situation: Greenfield Digital's Google Ads CPA increased last month. Meta ROAS improved. Overall revenue was flat. The client expects a monthly report explaining what happened.
Manual workflow (55 minutes):
The account manager opens Google Ads, pulls the last 30 days versus the prior 30 days, and notes that CPA rose from $29.60 to $38.20—a 29% increase. She switches to the campaign view, identifies that Brand Search drove most of the increase, and traces it to an audience expansion that diluted conversion quality. She opens Meta Ads Manager separately, notes that prospecting ROAS improved from 2.1x to 2.8x. She opens GA4 to check on-site conversion rates. Then she opens the report template, writes the executive summary, fills in the KPI section, adds the campaign table, writes per-channel commentary, drafts two recommendations, formats the PDF, and emails it.
Conversational analytics workflow (90 seconds):
The account manager types: "How did Greenfield Digital perform last month?" The platform returns an answer with the same specific findings—CPA up 29% driven by Brand Search audience expansion, Meta ROAS up from 2.1x to 2.8x, overall revenue flat—plus a recommendation to narrow the Brand Search audience back to the original targeting. She clicks "Doo a report." The report generates with the agency's branding, the executive summary already written, the KPIs compared, the campaigns listed. She reviews it, adjusts one sentence in the recommendation, and sends.
The output quality is comparable. The time is not. And critically, the conversational analytics version cross-referenced all three platforms simultaneously—something the manual process handles sequentially, increasing the chance of missing a connection between channels.
The time math
The economics are straightforward.
A 20-client agency using traditional reporting tools spends roughly 7 to 20 hours per month on client reports. At an agency billable rate of $150 per hour, that is $2,250 to $4,500 per month in capacity consumed by reporting.
With conversational analytics, the same 20 reports take roughly 20 minutes total—one question per client, one click to generate each report. Call it an hour with review time.
That is 14 to 29 hours per month recovered. Not eliminated from the business—redirected to work that actually requires human judgement. Strategy sessions. Creative direction. Client relationship management. The work that agencies are hired to do and that reporting has been stealing time from.
Over a year, that is 168 to 348 hours. At $150 per hour, that is $25,200 to $52,200 in recovered billable capacity. Against a tool cost of $99 to $329 (annual) per month, the return is not close.
White-labelling: the agency gets credit
Client reporting is a brand touchpoint. When an agency sends a report, it needs to look like it came from the agency—not from whatever tool generated it.
Conversational analytics reporting handles this by applying the agency's branding automatically. Logo, colours, fonts—all pulled from the agency's white-label settings and applied to every report without manual formatting. Client-specific branding overrides are supported for agencies that customise per-client.
The platform disappears. There is no "Powered by" hero banner, no product logo competing with the agency's identity. The client sees a report that looks like the agency built it by hand. The only difference is that it took 30 seconds instead of an hour.
This matters because the alternative—exporting a generic template from a dashboard tool and then manually applying branding—is one of the most time-consuming parts of the traditional workflow. Agencies that have standardised their templates still spend 10 to 15 minutes per report on formatting. White-label automation removes that entirely.
Scheduled delivery
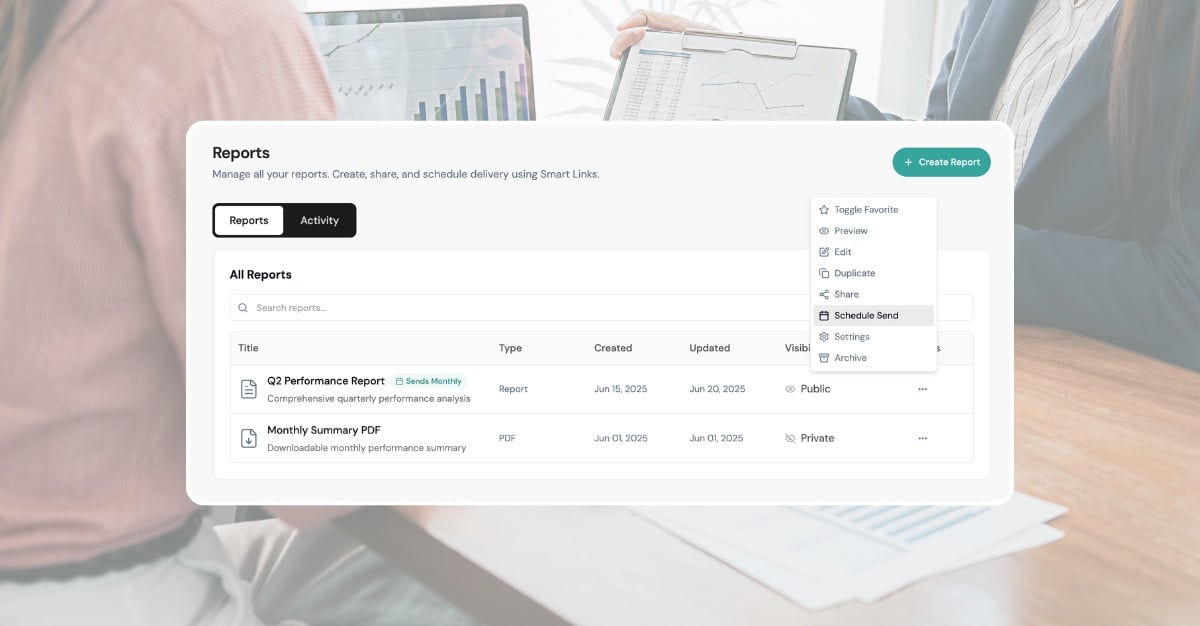
Reports do not need to be generated manually each month. Once a conversational analytics report exists, it can be scheduled for recurring delivery—weekly, monthly, or on a custom cadence.
On the scheduled date, the platform regenerates the report with current data, applies the agency's branding, renders a fresh PDF, and emails it to the recipient list. The agency does not need to log in, ask a new question, or click anything. The client receives a branded, up-to-date report on time, every time.
For practical rules on keeping automated reports personal, see how to automate without losing the human touch. This is where the time savings compound. The first report takes 30 seconds to generate from a conversation. Every subsequent delivery takes zero time. For a 20-client agency sending monthly reports, that is 20 reports per month running on autopilot—each with fresh data, AI-written narratives, and current recommendations.
The narrative updates with the data. If CPA spiked this month, the executive summary reflects that. If a campaign was paused, it disappears from the performance table. The report is not a static snapshot reused month after month—it is a live document that regenerates with context.
What this changes for agencies
The shift from manual reporting to conversational analytics reporting is not incremental. It is structural. The workflow compresses from five steps to two: ask and send.
This changes three things about how an agency operates.
Reporting stops being a bottleneck. When reports take under a minute instead of 20-60 minutes, the end-of-month crunch disappears. Account managers can generate a report on Tuesday, review it, and schedule delivery for Friday. No late nights. No "I'll get to your report tomorrow" emails.
Junior team members can produce senior-quality reports. The explanation—the part that requires experience and judgement—is generated by the platform. A junior account coordinator can ask the right question and produce a report with the same depth and specificity as a 10-year veteran. The platform encodes the analytical thinking that used to live only in senior heads.
Agencies can take on more clients without adding headcount. If reporting capacity was the constraint—and for most agencies under 20 employees, it is—then removing that constraint means the same team can serve more clients. The ratio shifts from 8 to 10 clients per account manager to 15 to 20, because the reporting load per client drops from hours to minutes.
Report quality becomes consistent across the team. In a manual workflow, report quality varies by who writes it. The head of performance produces a detailed, insightful summary. The junior account coordinator produces a competent but surface-level one. Clients notice the difference—and the clients assigned to junior staff get a worse experience. With conversational analytics, every report draws from the same analytical depth. The platform applies the same rigour to every client, every month. The quality floor rises to match the best work your senior team produces, because the explanation is generated from the data, not from the individual writer's experience level.
The reporting bottleneck was never the data
Every reporting tool built in the last decade has focused on the same problem: getting data from platforms into a format you can show a client. API connections, automated imports, template builders, drag-and-drop widgets. The data pipeline is largely solved.
What was never solved is the explanation. The paragraph that tells a client what happened, why it happened, and what to do about it. That has always been a human task because no tool was built to do it.
Conversational analytics is built to do it. You ask a question, get an explanation, and turn it into a report. The entire workflow that used to take 20 to 60 minutes per client happens in under a minute. The quality is not just comparable to what a human would write—it is often better, because the platform cross-references every connected data source simultaneously, catches patterns that a human scanning a spreadsheet would miss, and never forgets to include the comparison to last period.
The data was never the hard part. The explanation was. And now the explanation writes itself.
For a broader look at how agencies apply conversational analytics beyond reporting—alerts, client portals, scaling client capacity—see conversational analytics for marketing agencies. If you are evaluating tools in this category, the platform evaluation guide covers what to test and what to watch for.