Manual client reporting consumes more capacity than most agencies realize. The data pull is automated by now — but the narrative, the interpretation, the "here is what happened and what to do next" paragraphs — that step is still manual, still repetitive, and still expensive.
The hidden cost of manual reporting
The numbers are specific:
- Average agency spends 20 to 60 minutes per client per month on the narrative explanation
- 60% of that time is spent on data collection and formatting
- Only 40% is spent on actual analysis and insights
- Manual errors occur in 23% of reports (industry average)
For a 20-client agency, that's 160-240 hours monthly—equivalent to one full-time employee.
The Automation Opportunity
Reporting automation isn't just about saving time—it's about transforming your entire client relationship:
Immediate Benefits
- Time Savings: 80-90% reduction in report preparation time
- Consistency: Standardized formatting and calculations across all clients
- Accuracy: Elimination of copy-paste errors and calculation mistakes
- Scalability: Handle more clients without proportional staff increases
Strategic Advantages
- Real-time Insights: Always-current data instead of month-old snapshots
- Deeper Analysis: More time for strategic thinking and recommendations
- Client Satisfaction: Faster turnaround and more comprehensive insights
- Competitive Edge: Professional presentation and advanced capabilities
Building Your Automation Strategy
Phase 1: Assessment and Planning
Audit Your Current Process
- Map out every step in your reporting workflow
- Identify time-consuming manual tasks
- Document data sources and update frequencies
- Catalog report templates and formats
Define Automation Goals
- Set specific time-saving targets
- Identify quality improvement opportunities
- Plan for scalability requirements
- Establish success metrics
Phase 2: Data Infrastructure
Centralize Data Sources
The foundation of automated reporting is unified data:
- Connect all marketing platforms (Google, Facebook, LinkedIn, etc.)
- Integrate CRM and sales data
- Include website analytics and conversion tracking
- Sync financial and ROI data
Establish Data Quality Standards
- Implement validation rules for incoming data
- Set up anomaly detection for unusual patterns
- Create data backup and recovery procedures
- Monitor data freshness and completeness
Phase 3: Template Development
Create Standardized Templates
Develop templates that balance consistency with customization:
- Executive summary with key metrics
- Performance deep-dives by channel
- ROI and attribution analysis
- Competitive benchmarking sections
- Action items and recommendations — see how conversational analytics changes this workflow
Design for Multiple Formats
- Interactive dashboards for real-time monitoring
- PDF reports for formal presentations
- PowerPoint templates for client meetings
- Email summaries for quick updates
Key Components of Automated Reporting
1. Data Collection and Processing
Automated Data Extraction
- Schedule regular API calls to all platforms
- Implement error handling and retry logic
- Normalize data formats and time zones
- Validate data quality before processing
Intelligent Data Transformation
- Calculate custom metrics and KPIs
- Apply attribution modeling
- Segment data by relevant dimensions
- Create trend analysis and comparisons
2. Dynamic Content Generation
Automated Insights
- Generate natural language summaries of performance
- Identify significant changes and trends
- Create personalized recommendations
- Highlight areas requiring attention
Visual Elements
- Automatically update charts and graphs
- Apply consistent branding and styling
- Generate appropriate visualizations for data types
- Create mobile-friendly layouts
3. Distribution and Delivery
Scheduled Delivery
- Automate report generation and sending
- Customize delivery schedules per client
- Include relevant attachments and supplementary data
- Track delivery and engagement metrics
Multi-Channel Distribution
- Email delivery with embedded visualizations
- Dashboard links for real-time access
- Slack or Teams notifications for urgent updates
- API endpoints for client system integration
Advanced Automation Features
Predictive Analytics
- Forecast future performance based on historical trends
- Identify opportunities for optimization
- Predict budget requirements and ROI expectations
- Flag potential issues before they impact performance
Anomaly Detection
- Automatically identify unusual performance patterns
- Alert teams to significant changes in real-time
- Distinguish between normal variation and actionable insights
- Provide context for anomalies when possible
Competitive Intelligence
- Automatically gather competitive data where available
- Compare client performance to industry benchmarks
- Track competitive campaign activity and strategies
- Generate competitive analysis sections
Custom Calculations
- Implement client-specific metrics and KPIs
- Handle complex attribution models
- Calculate lifetime value and customer acquisition costs
- Generate margin and profitability analysis
Technology Stack Considerations
Reporting Platforms
Enterprise Solutions:
- Tableau, Power BI for advanced visualizations
- Looker, Sisense for embedded analytics
- Custom solutions using React/D3.js
Marketing-Specific:
- LDOO for agency-focused automation
- Supermetrics for data collection and basic reporting
- TapClicks for multi-client management
Data Integration Tools
- Zapier/Make for simple integrations
- Fivetran/Stitch for robust data pipelines
- Custom APIs for specialized requirements
- LDOO's native connectors for marketing platforms
Infrastructure Components
- Cloud data warehouses (Snowflake, BigQuery)
- Message queues for reliable processing
- CDNs for fast report delivery
- Authentication systems for secure access
Implementation Best Practices
Start Small, Scale Fast
- Begin with your most important clients
- Focus on high-impact, low-complexity reports first
- Iterate based on feedback before scaling
- Maintain manual backup processes during transition
Maintain the Human Touch
- Always include strategic commentary and insights
- Provide contact information for questions
- Schedule regular review calls to discuss automated reports
- Use automation to enhance, not replace, client relationships
Quality Assurance
- Implement multi-stage review processes
- Set up automated testing for data accuracy
- Create manual spot-check procedures
- Maintain version control for templates and calculations
Training and Change Management
- Train team members on new automated systems
- Create documentation for common tasks and troubleshooting
- Establish clear escalation procedures for issues
- Celebrate early wins to build momentum
Common Automation Pitfalls
Over-Automation
- Don't automate everything immediately
- Maintain flexibility for client-specific requests
- Keep human oversight for strategic decisions
- Allow for manual overrides when necessary
Poor Data Quality
- Garbage in, garbage out applies to automation
- Invest in data validation and cleaning
- Monitor for API changes and deprecations
- Have backup data sources when possible
Lack of Customization
- Avoid one-size-fits-all approaches
- Allow for client-specific branding and metrics
- Provide different levels of detail for different audiences
- Enable easy customization of report sections
Insufficient Testing
- Test automation with historical data first
- Validate calculations against manual reports
- Check formatting across different devices and platforms
- Have rollback procedures for system failures
When evaluating platforms, test each of these failure modes with your own data before committing.
Measuring Success
Efficiency Metrics
- Time spent on report creation (before vs. after)
- Number of manual errors reduced
- Client capacity per team member
- Cost per report generated
Quality Metrics
- Client satisfaction scores
- Report accuracy rates
- Insight depth and relevance
- Response time to client questions
Business Impact
- Client retention rates
- New client acquisition capacity
- Team productivity improvements
- Revenue per employee
The Future of Automated Reporting
AI-Powered Insights
- Natural language generation for report narratives — this is what conversational analytics enables today
- Automated strategy recommendations
- Predictive modeling for campaign optimization
- Intelligent alerting based on business context
Enhanced Interactivity
- Voice-activated queries and commands
- Augmented reality data visualization
- Collaborative editing and annotation
- Real-time discussion threads
Integration Expansion
- Direct integration with client business systems
- Automated action triggers based on performance thresholds
- Cross-platform campaign optimization
- Unified customer journey tracking
The gap between automation and explanation
Most reporting automation tools solve the data problem. AgencyAnalytics, DashThis, and Whatagraph connect to your marketing platforms, pull the numbers on a schedule, and drop them into a branded template. That is workflow automation, and it works. The data shows up, the formatting is consistent, and the delivery is on time.
What none of them automate is the explanation.
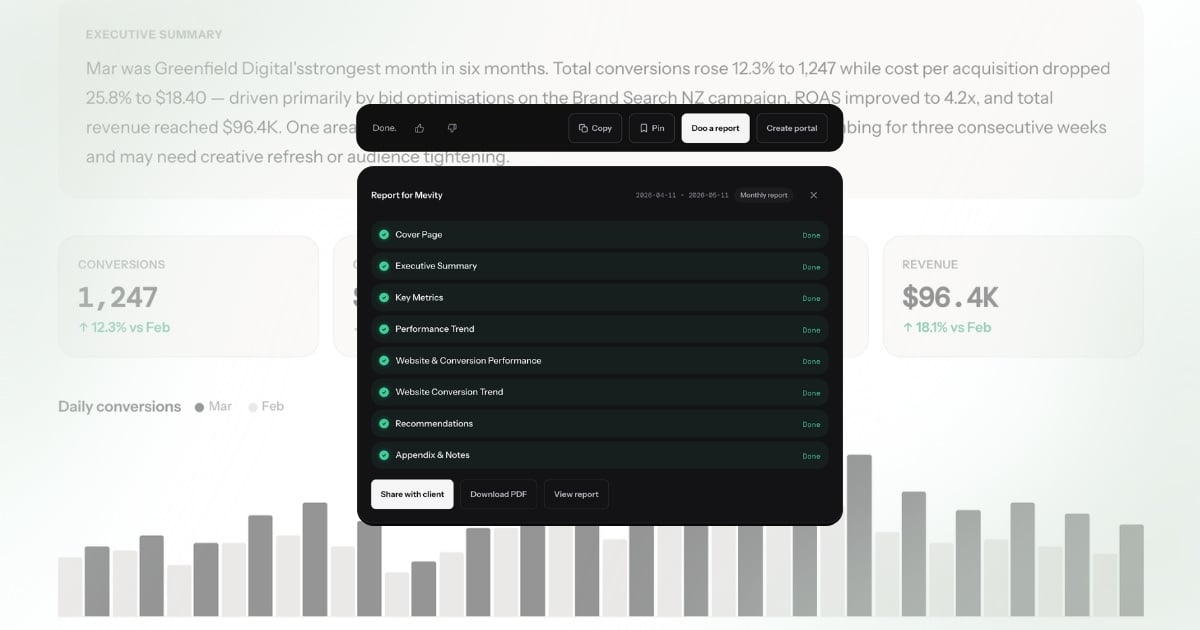
Every client report worth sending includes 3-5 paragraphs that answer the question the numbers alone cannot: what happened and why. Did revenue drop because of a Meta audience change or because the landing page broke on mobile? Is CPA rising because of seasonal competition or because the ad creative is fatiguing? These are the paragraphs that take 20-30 minutes per client, and they are the paragraphs that clients actually read.
Existing tools leave this step entirely manual. The data is automated. The template is automated. The delivery is automated. But the content — the narrative that makes the report useful — is still written by a human staring at a spreadsheet.
Conversational analytics closes this gap. Instead of pulling data and then interpreting it, you ask a question: "Why did CPA increase for Greenfield Digital last week?" The system returns an answer with specific numbers, a primary cause, and a supporting observation. That answer becomes a section in a branded report. The entire workflow — data collection, interpretation, narrative generation, formatting, and delivery — is automated end to end.
This is the distinction between automating the container and automating the content. The container is the template: consistent headers, branded colours, scheduled delivery. Existing tools handle this well. The content is the narrative: the explanation, the comparison, the recommendation. That is the part that takes the most time and delivers the most value to clients. Automating the container without automating the content saves formatting time but leaves the expensive step untouched. A tool that automates both — that connects data to report generation through a single question — eliminates the bottleneck entirely.
Agencies that adopt this model report spending under 2 minutes per client on what previously took over an hour. The time savings compound: a 20-client agency recovers 20-25 hours per month, and the narrative quality is more consistent because the explanation is grounded in the actual data rather than reconstructed from memory.
What full automation actually looks like
The difference between partial and full automation is measurable. Here is what the workflow looks like in practice.
Before (partial automation — template tool + manual narrative):
- Pull data from platforms into reporting tool: 10 minutes
- Review data and identify key changes: 20 minutes
- Write the narrative explanation for the client: 30 minutes
- Format, proofread, and add recommendations: 10 minutes
- Send to client or schedule delivery: 5 minutes
- Total: ~75 minutes per client
For a 20-client agency, that is 25 hours per month — most of it spent on interpretation and writing.
After (full automation — conversational analytics):
- Ask a question about the client's performance: 10 seconds
- Review the answer for accuracy and completeness: 30 seconds
- Generate a branded report from the answer: 30 seconds
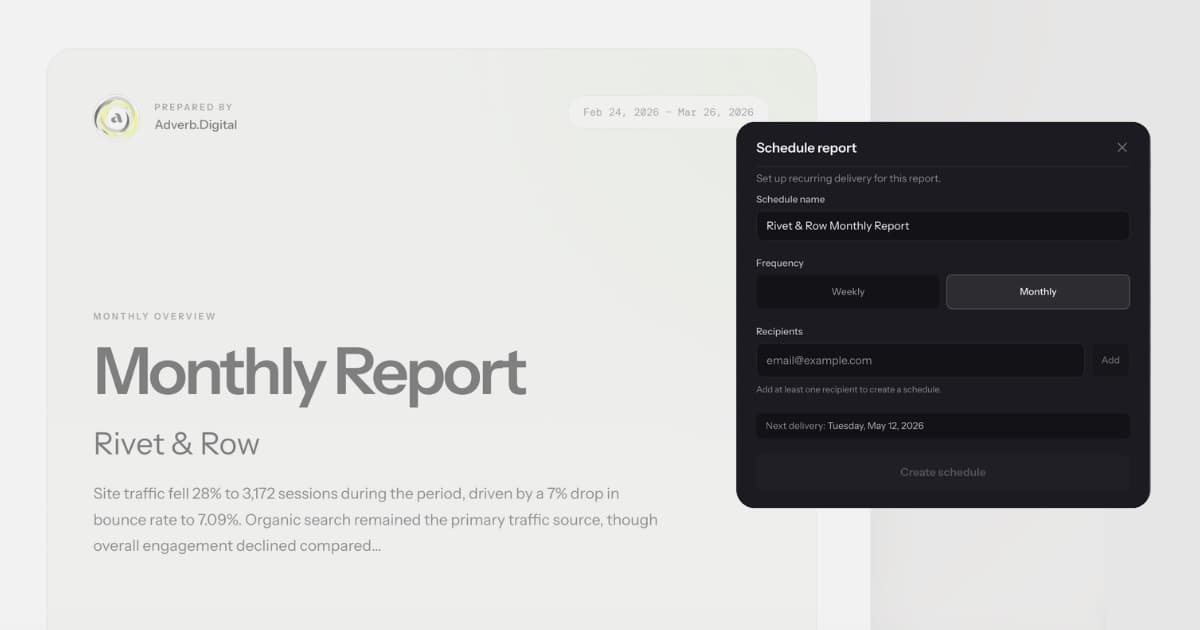
- Schedule recurring delivery to the client: 30 seconds
- Total: ~2 minutes per client
The 73-minute gap is not saved by working faster. It is saved by eliminating steps. The data pull happens automatically via connected integrations. The interpretation happens at ask time. The narrative is generated from the interpretation. The formatting uses the agency's branding, applied automatically. There is no copy-paste step, no spreadsheet review, no manual formatting pass.
At an agency billing rate of $150/hour, that is $3,600/month in recovered capacity across 20 clients. More practically, it is 25 hours that your team can spend on strategy, creative, and client communication instead of report assembly.
The constraint is no longer time — it is review. A 2-minute workflow where 30 seconds is spent checking the answer is a fundamentally different operating model from a 75-minute workflow where 30 minutes is spent writing. The first scales with clients. The second scales with headcount.
Getting started
Connect your data sources (Google Ads, Meta, GA4, Search Console, Shopify — one-click OAuth for each), ask your first question about a client's performance, and generate your first branded report from the answer. The entire setup takes under five minutes.
The reporting workflow that used to take 20 to 60 minutes per client happens in under two minutes. The capacity that comes back goes to the work your team was hired to do — strategy, optimization, and growth.
What full automation actually looks like
The layers of automation covered above — data pull, scheduling, template formatting, delivery — each have mature tools. But automation stops at the point where data needs to become an explanation. The narrative section of the report, the part that tells the client what happened and why, remains manual at most agencies. Template tools can insert a metric into a sentence. They cannot explain why that metric changed or what the client should do about it.
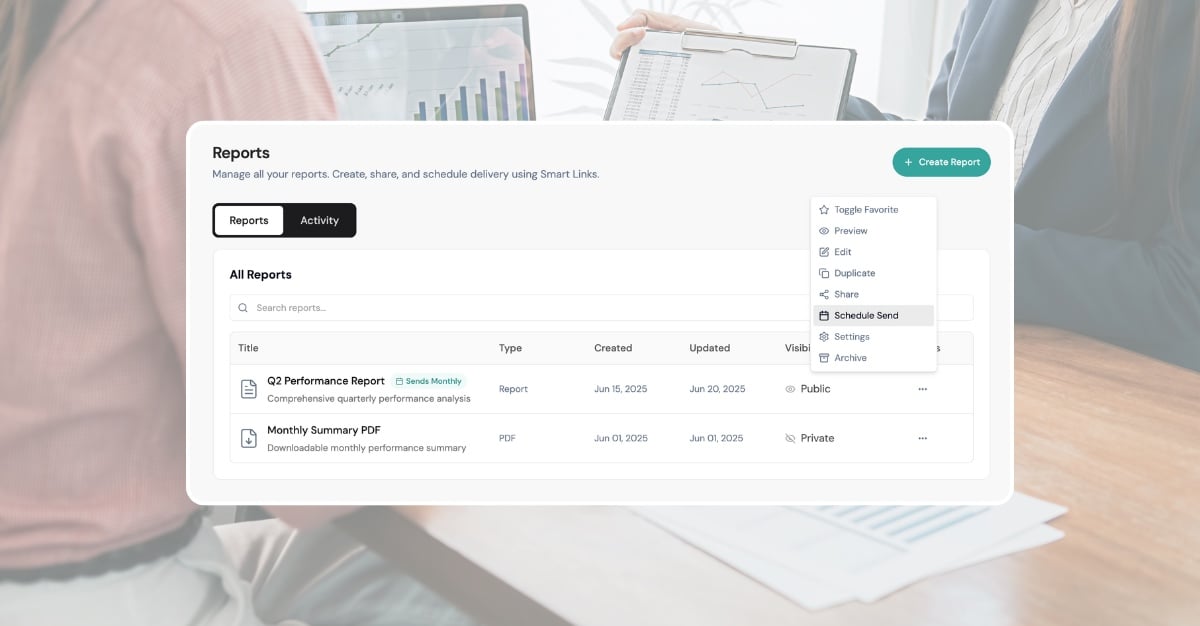
LDOO automates that last layer. Ask "How did this client perform last month?" and get an answer that includes specific metrics, period-over-period comparisons, causal analysis, and a recommended next step. Turn that answer into a branded PDF report with one action. Schedule it for weekly or monthly delivery. The entire chain — from raw API data to a formatted report in the client's inbox — runs without manual interpretation or formatting.
That is the difference between partial automation and full automation. Partial automation handles data and charts but leaves the narrative to a human. Full automation handles data, charts, AI-generated narrative, and branded delivery. The first saves roughly 60% of reporting time. The second saves 95%. For agencies managing 15 or more clients, the gap between 60% and 95% is the difference between one person handling all reporting and every account manager writing their own summaries.