Every agency that has tried automated reporting has had the same experience. The first month feels like a breakthrough. Reports go out on time. Data is pulled automatically. The team reclaims hours of their week. Then clients start responding with "Thanks, but what does this mean?" and "Can you walk me through the numbers?"
The automation saved the team time, but it didn't save the client from having to interpret a wall of charts. That is not automation. That is delegation to the client. For a deeper look at why the current reporting workflow is structurally broken, see why reporting is broken.
This is the central tension of automated reporting: the part that takes the most time (pulling data, formatting tables, scheduling delivery) is not the part clients value. The part clients value is the three sentences that explain what happened, why it happened, and what to do about it. Most automation skips that entirely.
Here is how to fix it.
Why most automated reports feel robotic
The problem is straightforward. Most reporting tools automate the container — the template, the data pull, the formatting, the scheduled send — but leave the content hollow. A report with accurate numbers and no explanation is just a prettier spreadsheet. The client still has to do the interpretive work themselves, which is the work they hired you to do.
Consider a typical automated report. It shows that CPA rose from $38 to $47 last week. The chart is clean. The branding is correct. It arrived on Tuesday morning as promised. But the client opens it and thinks: Is that bad? Why did it happen? Should I be worried? What are you doing about it?
Those four questions are the entire reason the client reads the report. If the report does not answer them, it does not matter how polished the formatting is. The client feels unserved.
The "human touch" that clients value is not the formatting. It is the interpretation — the "here's what happened and what we recommend" paragraph that turns raw data into a strategic conversation. Getting that explanation right is a skill in itself, and one worth mastering regardless of your tooling (see how to explain marketing data to clients). When agencies say they want to keep the human touch, what they mean is they want to keep the explanation layer. Most automation tools don't have one, so the account manager either writes it manually (defeating the purpose of automation) or skips it (losing the client's trust over time).
What clients actually want from a report
After years of building reporting tools for agencies, the pattern is consistent. Clients want three things from every report, and they want them stated directly — not implied by a chart.
What happened. Specific numbers, not visualisations they have to decode. "Revenue increased 14% to $127,400" is useful. A line chart trending upward is not — at least not on its own. The chart supports the statement; it does not replace it.
Why it happened. The cause, stated directly. "The increase was driven by the new lookalike audience launched on March 12th, which delivered a 2.3x ROAS in its first two weeks." Clients do not want to guess. They want the account manager's analysis, even if the analysis is provisional.
What to do next. One clear recommendation per finding. "We recommend increasing the daily budget on this audience from $200 to $350 while performance holds." Not "we'll continue to monitor" — that is the absence of a recommendation dressed up as one.
If your automated report delivers all three, it has the human touch. If it delivers only the numbers, it doesn't — regardless of how well-branded the PDF is.
This is the same standard we apply to every answer LDOO generates. An explanation that an account manager could paste into a client email without editing. That bar changes how you think about what "automation" means.
The automation spectrum
Not all reporting automation is equal. Most agencies sit at Level 2 or 3 and assume Level 4 requires sacrificing quality. It doesn't — but it does require a different kind of tool.
Level 1: Manual everything
Export data from each platform. Paste into a spreadsheet or slide deck. Build charts. Write commentary. Format for the client. Attach and send.
Time per client: 20-60 minutes.
This is where most agencies start, and many stay here longer than they should. The output can be excellent — the account manager has full control over every sentence — but it does not scale. At 15 clients, Level 1 reporting consumes 15-22 hours per month. That is a part-time employee doing nothing but reporting.
Level 2: Data pull automated
API connections sync data from Google Ads, Meta, GA4, Search Console, and other platforms into a central tool. The data is current and accurate without manual exports.
Time per client: 40-60 minutes.
The data step is solved, but the account manager still builds the report manually — selecting metrics, arranging sections, writing commentary from scratch. The bottleneck shifts from "getting the data" to "making sense of the data," which was always the harder task.
Level 3: Template automation
Branded templates with pre-configured sections. Data populates automatically. Reports can be scheduled for recurring delivery. The container is fully automated.
Time per client: 30-50 minutes.
This is where tools like AgencyAnalytics, DashThis, and Whatagraph operate. They are good at this level. But the account manager still writes every narrative paragraph, every recommendation, every "here's what this means for your business" sentence. The time savings from Level 2 to Level 3 are real but incremental. The writing is still the bottleneck.
Level 4: Full automation with explanation
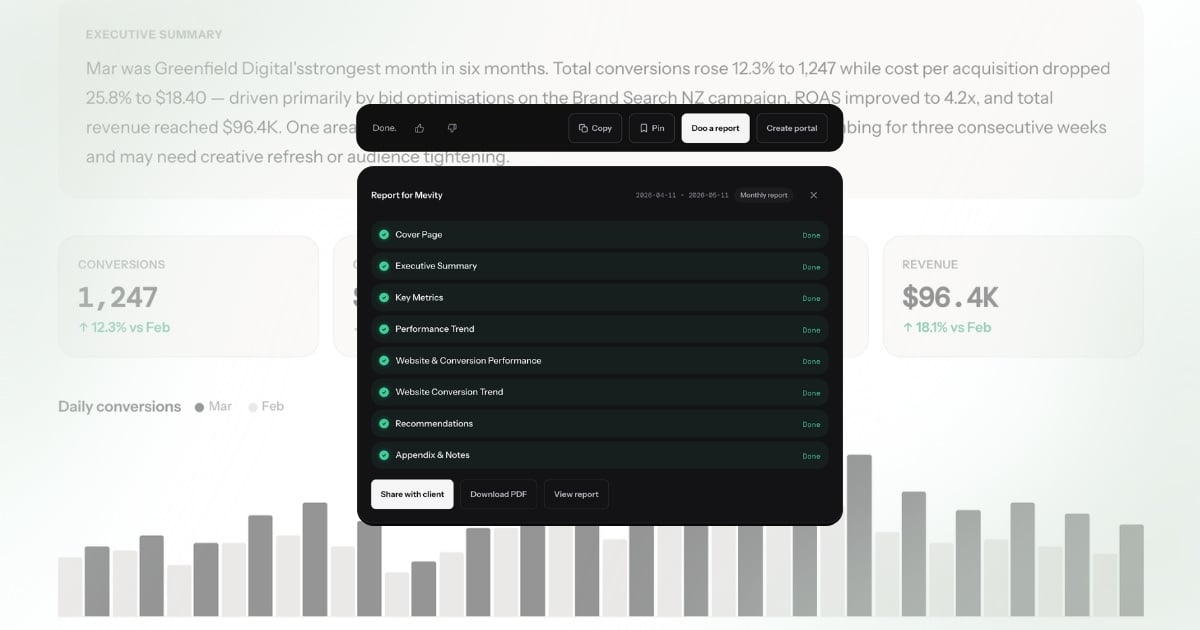
Data, explanation, formatting, and delivery are all automated. The AI generates the narrative — specific numbers, causes, recommendations — and the account manager reviews and adjusts before sending.
Time per client: 2-5 minutes.
This is the gap between Level 3 and Level 4: the explanation layer. A tool that can look at the data and write "CPA increased 22% to $47.30, driven by the audience expansion on March 5th — recommend reverting to the original targeting" is doing fundamentally different work than a tool that pulls the number $47.30 into a template and leaves the interpretation to you.
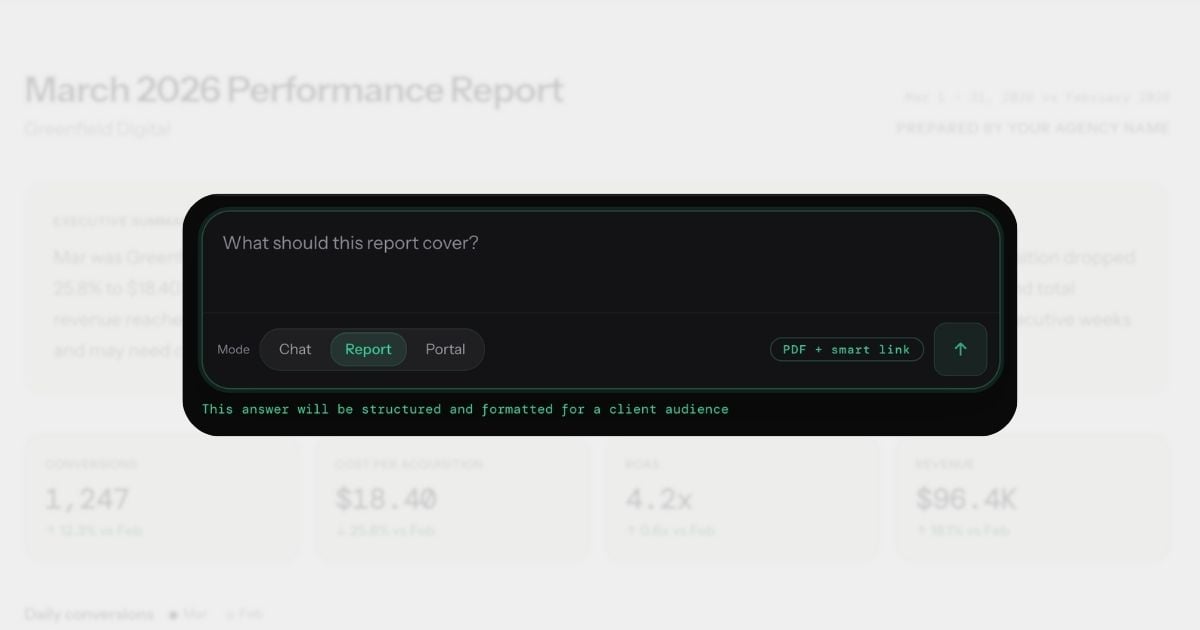
Conversational analytics is what makes Level 4 possible. Instead of configuring a report template and then writing the narrative, you ask a question in plain English and get an explanation you can send to a client. The report is a byproduct of the conversation, not a separate workflow.
How to keep the human touch at Level 4
Here is the part most automation advocates skip: Level 4 does not mean zero human involvement. It means the human's role changes from writer to editor.
The AI generates the explanation. The account manager reviews it, adjusts the tone, adds context the AI couldn't know, and approves the send. The human touch is in the review — catching nuance the AI missed, referencing a recent client conversation, adjusting the recommendation based on the client's stated priorities.
This is a better use of the account manager's time than writing from scratch. Editing a competent draft takes 2-5 minutes. Writing from a blank page takes 30-60. The output quality is comparable or better, because the AI never forgets to check a metric or miscalculates a percentage change.
The key insight: the human touch was never about typing the words. It was about applying judgement. Level 4 automation preserves the judgement while eliminating the typing.
What this looks like in practice
Here is a concrete example of the difference between AI-generated and human-reviewed output.
The AI generates:
CPA increased 22% to $47.30, driven by the audience expansion on March 5th. The new broader audience delivered higher reach but lower conversion rates. Recommend reverting to the original targeting to restore CPA to the $38 baseline.
This is accurate. The numbers are right. The cause is identified. The recommendation is clear. For many clients, this is ready to send as-is.
The account manager reviews and adjusts:
CPA increased 22% to $47.30, driven by the audience expansion we discussed on our March 4th call. I've already reverted the targeting as of yesterday — expect CPA to normalize to the $38 range by next week. I'll confirm in our Thursday check-in.
The difference: the AI got the data right. The human added the relationship context — the fact that this was a deliberate experiment discussed with the client, that action has already been taken, and that there is a follow-up scheduled. Together, the output is better than either alone.
This is what Level 4 looks like in practice. The AI does 90% of the work. The human adds the 10% that makes it feel personal. Total time: 3 minutes instead of 45.
For a deeper look at how to write explanations clients actually read, see our guide on how to explain marketing data to clients.
Five rules for automated reports that feel personal
These are practical, specific, and non-negotiable if you want automated reports that clients value.
1. Always include at least one sentence the AI couldn't know
Every report should contain at least one reference to something outside the data: a recent conversation with the client, their stated priorities for the quarter, an upcoming campaign launch, a seasonal pattern specific to their business. This is the sentence that proves a human reviewed the report.
"The dip in traffic aligns with the site migration you flagged last week — we expect recovery within 10-14 days" is worth more than three pages of charts.
2. Use the client's language, not platform jargon
If the client calls their brand awareness campaign "the spring push," call it that in the report. If they measure success by "leads" not "conversions," use their word. If they set a target of $40 CPA, reference that target explicitly: "CPA came in at $36.20, 10% below your $40 target."
The AI pulls data by platform names and metric IDs. The human translates those into the client's vocabulary. This is a small edit that makes a large difference in how the report reads.
3. Review every report before the first three sends
Do not set up automation and walk away on day one. Review the first three reports for each client carefully. You are calibrating: Does the AI emphasize the right metrics? Is the tone appropriate for this client? Are the recommendations aligned with the client's actual goals?
After three sends, you will know the AI's tendencies and can review more quickly. But the first three are where you catch the misalignments that would erode trust if they went unreviewed.
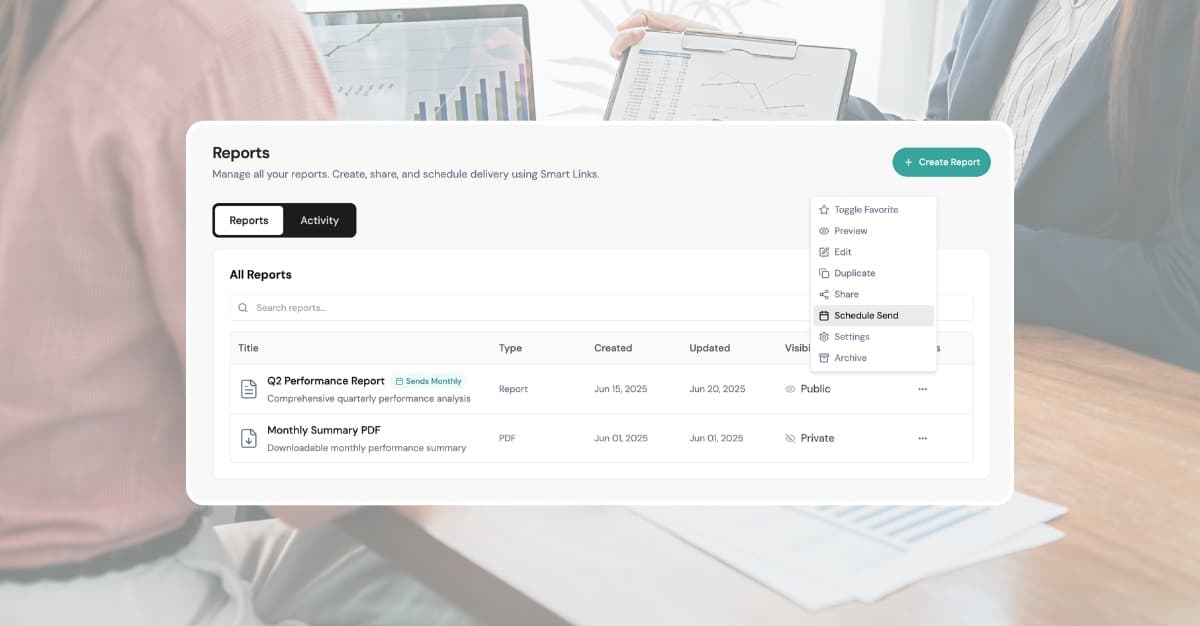
4. Schedule delivery for a time the client expects it
Tuesday or Wednesday morning, 8-9am in the client's timezone. Not midnight Saturday. Not Friday afternoon. The timing signals professionalism as much as the content does.
If you have a standing weekly call with the client, send the report 24 hours before the call. This gives them time to review it and come to the call with specific questions instead of spending the first 15 minutes walking through numbers.
5. Follow up on the report within 48 hours
An automated report followed by silence feels automated. An automated report followed by a two-minute Loom video saying "Here are the two things I'd focus on this week" feels personal. The follow-up does not need to be long. It needs to exist.
Even a one-line email — "Saw the ROAS dip on the remarketing campaign, already adjusting the frequency cap" — transforms the report from a document into a conversation.
The line between automation and laziness
Here is the uncomfortable truth: if you send an automated report and never review it, the client will eventually notice. Not because the data is wrong — the data will be fine. Because the report will be tone-deaf.
It will report on a campaign the client paused two days ago. It will miss context about a seasonal promotion that explains a traffic spike. It will recommend increasing budget on a channel the client told you last week they want to wind down. The data is accurate. The advice is wrong. And the client loses confidence not in the tool, but in you.
Review is not optional. The goal of Level 4 automation is to reduce the time from 60 minutes to 5 minutes per client, not from 60 minutes to zero. Five minutes of review is the difference between "our agency uses smart tools" and "our agency doesn't actually look at our account."
The agencies that get this right use automation as leverage, not as a replacement. They generate reports from conversations, review the AI's output, add their context, and send — all in under five minutes. The client receives a report that is data-accurate, well-explained, and personally relevant. The agency reclaims 80% of their reporting time without sacrificing an ounce of quality.
That is what good automation looks like. Not removing the human. Amplifying them.
For more on how conversational analytics changes the reporting workflow, read what conversational analytics means for client reporting.