The report that takes 20 to 60 minutes to build is the same report every month. KPIs at the top, campaign breakdown in the middle, narrative explanation, recommendations at the end. The structure never changes. The only thing that changes is the numbers.
What if the entire thing wrote itself from a single question? Not a template you fill in. Not a dashboard you screenshot. A complete, branded client report generated from one sentence, in under 60 seconds. That is what LDOO does, and this post walks through exactly how it works.
Step 1: Ask the question
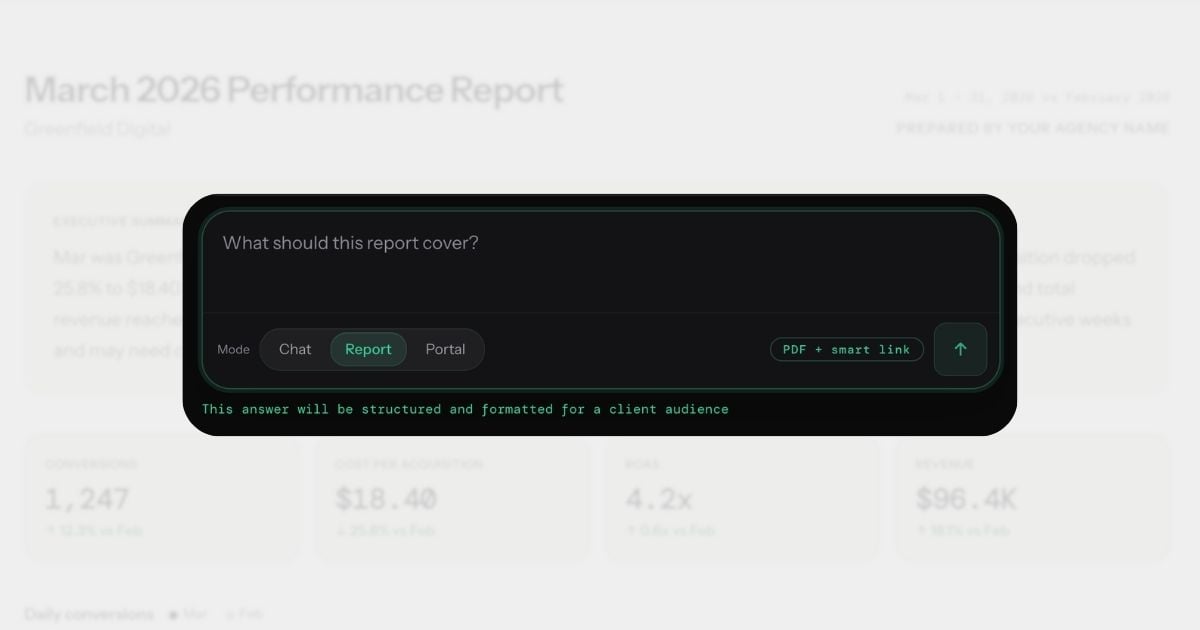
Open LDOO, select your client, and type a question. Something like: "How did Greenfield Digital perform last month?"
Behind the scenes, LDOO does several things simultaneously. It parses your natural language question, identifies which data sources are relevant, and queries GA4, Google Ads, Meta Ads, and Search Console in a single pass. There is no need to open four tabs, export four CSVs, or copy numbers into a spreadsheet. The system pulls from every connected source at once.
The query pipeline works in three stages. First, your question is converted into a structured data request using LDOO's conversational analytics engine. Second, the system fetches live data from your connected APIs — verified, scoped to the correct client and date range. Third, an AI interpretation layer reads the raw results and writes a specific, numbers-first explanation of what happened and why. The entire process takes a few seconds.
You can explore the Ask experience to see how the conversation interface replaces the traditional reporting workflow.
Step 2: Review the answer
The answer that comes back is not a summary of summaries. It includes specific numbers, period-over-period comparisons, causal analysis, and a clear recommendation. It is written at the level a client can read without calling you to explain it.
Here is what an answer actually looks like:
CPA declined 18% month-over-month, dropping from $24.60 to $20.17, driven primarily by improved conversion rates on Brand Search campaigns. Click volume held steady at 12,400, which means the efficiency gain came from better-qualified traffic rather than reduced spend. This is the third consecutive month of CPA improvement since the audience restructure in February. Recommend shifting 10–15% of budget from Generic Search into Brand Search NZ to accelerate the trend.
That is not a cleaned-up example. That is the level of specificity LDOO produces on every question. A primary cause stated directly, a supporting data point that validates it, a comparison anchor against the prior period, and an actionable recommendation. The kind of paragraph an account manager would paste into a client email without editing a word.
If the answer needs more depth, ask a follow-up. "Break that down by campaign" or "What happened with Meta specifically?" LDOO remembers the conversation context and builds on it.
Step 3: Generate the report
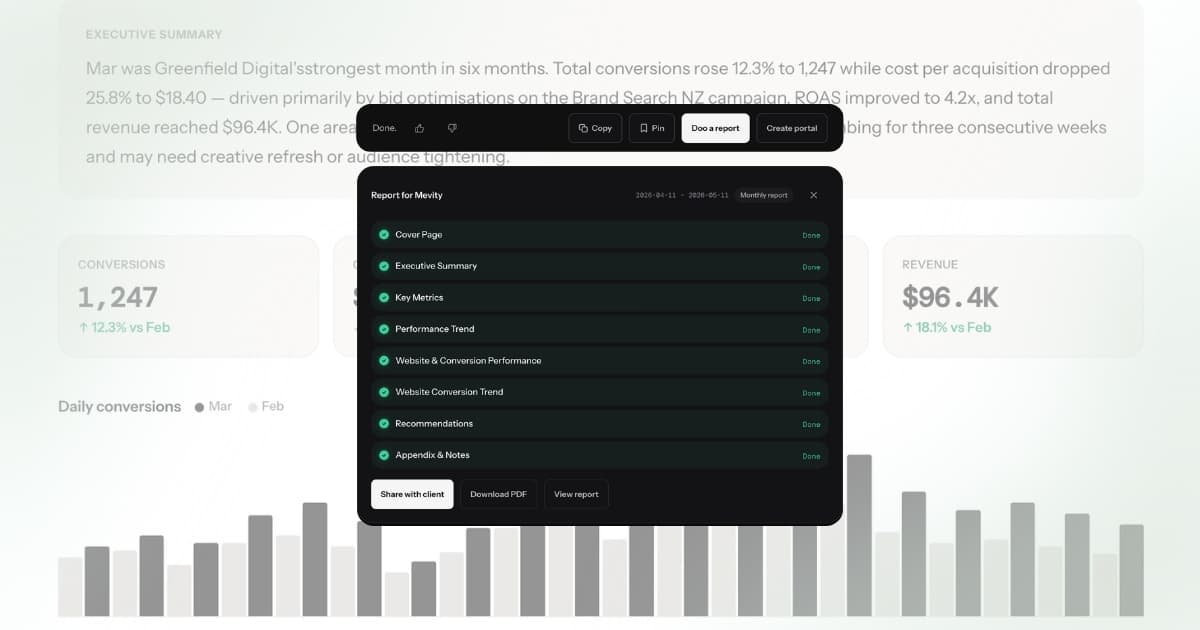
One click. Below every answer, LDOO offers the option to turn it into a full branded report. Click it, and the system assembles a multi-section PDF in under 60 seconds.
The report is not just the answer reformatted. LDOO generates an executive summary, a KPI overview with period-over-period comparison, a campaign-level breakdown with performance indicators, and a recommendations section — each written by AI from the underlying data, not copied from the conversation verbatim. The structure follows what clients expect from a professional agency report.
Your agency's branding is applied automatically. Logo, colours, fonts — all pulled from your white-label settings. LDOO appears nowhere on the report except a subtle "Powered by" footnote. The client sees your agency's name, your colours, your identity. You can learn more about the branding and white-label options and how the report generation pipeline works.
Step 4: Send or schedule
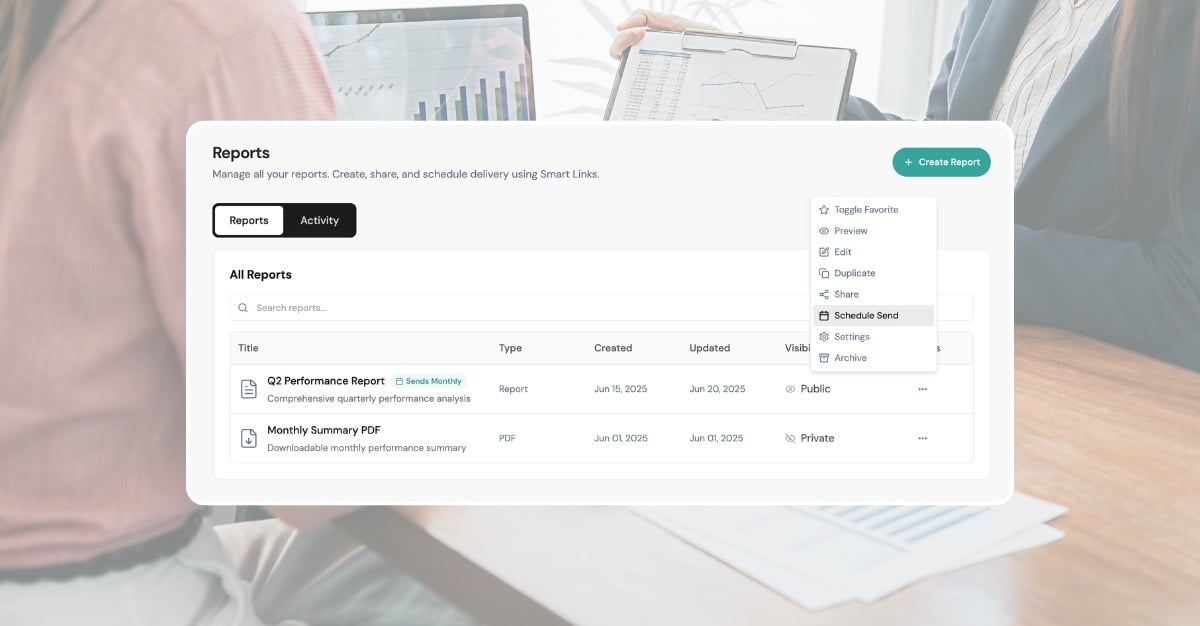
Once the report is generated, you have three options. Share it via a smart link — a branded, web-hosted version the client can open in their browser. Download the PDF directly and attach it to an email. Or schedule it for automatic delivery on a weekly or monthly cadence.
Scheduled delivery means the report regenerates with fresh data and sends itself to the client on the day and time you choose. Set it once, and the client gets an updated report every Monday morning, every first of the month, or whatever cadence works. No manual intervention required. See how scheduled reporting works.
The math on time saved
The numbers are straightforward. A manual client report takes 20-60 minutes on the low end: pull data from four platforms, format a document, write the narrative, review it, send it. For an agency with 20 clients, that is 20 clients multiplied by 20-60 minutes each, which equals 15 hours per month — nearly two full working days spent on assembly, not strategy.
With LDOO, the same 20 reports take 20 multiplied by 30 seconds: 10 minutes total. That is 14 hours and 50 minutes back every month. At a conservative agency rate of $100/hour, that is $1,483/month in recovered capacity — time your team can redirect to campaign optimization, new business pitches, or strategic planning. At $150/hour, it is over $2,200. The pricing page breaks down what each plan includes, but the math works on even the most conservative assumptions.
What the report actually includes
Every LDOO-generated report contains four sections. The executive summary is AI-written: a concise paragraph that tells the client what happened, why it happened, and what to do about it. The KPI overview shows the metrics that matter — revenue, CPA, ROAS, conversions, traffic — each with the current value, the prior period value, and the percentage change. No vanity metrics, no noise.
The campaign breakdown lists each active campaign with performance indicators: trending up, trending down, or steady. Metrics where "down is good" — CPA, bounce rate, cost per click — are colour-coded correctly, so a 15% drop in CPA shows green, not red. The recommendations section is assertive. "Increase Brand Search budget by 15%" — not "You may want to consider adjusting your budget allocation." Every recommendation is grounded in the actual data from that specific report period. The agency's branding wraps the entire document, and white-label settings let you customise the look per client if needed.
| Manual report | LDOO report | |
|---|---|---|
| Time per report | 20-60 minutes | Under 60 seconds |
| Data sources | Manual export from each platform | All sources queried in one pass |
| Narrative | Written by hand every month | AI-generated from live data |
| Branding | Template editing in Docs or Slides | Auto-applied from agency settings |
| Delivery | Manual email attachment | Smart link, PDF, or scheduled auto-send |
| Recommendations | Generic or skipped entirely | Specific, data-grounded, assertive |