There are 30 minutes hidden in every client report you send — the part between the dashboard being ready and the client actually getting it. The part where you write what happened and why. If you're searching for an AgencyAnalytics alternative, that's almost always why.
For a 20-client agency, those 30 minutes per client add up to 10 hours every month. Different client, same paragraph structure with different numbers.
LDOO is a conversational analytics platform that writes the narrative for you. You ask one question. The AI returns a specific explanation with numbers, causes, and a recommendation. The branded client report generates from that answer in under 60 seconds.
TL;DR: AgencyAnalytics builds the dashboard. You spend 30 minutes per client writing the report from it. LDOO writes the report from one question in under 60 seconds. For most agencies, that's the entire workflow.
Where the 30 minutes actually goes
Open AgencyAnalytics, DashThis, Whatagraph, Databox, or Looker Studio. The charts are right. The numbers reconcile. The white-label is clean. You could send the dashboard to the client tomorrow.
But you can't, because the client doesn't want a dashboard. They want to know what changed and why.
Answering that question takes 30 minutes per client report:
- 5 minutes scanning for movement worth flagging
- 10 minutes drilling into campaigns, channels, or pages that explain the movement
- 10 minutes writing the executive summary, the recommendation, the next-month plan
- 5 minutes formatting, exporting, sending
Multiply by 20 clients. That's 10 hours every month. Different client, same Google Doc template. Different ad spend, same "we recommend..." paragraph structure.
The dashboard is data. The report is interpretation. No dashboard tool ships interpretation — which is exactly the problem we wrote about when we killed the dashboard.
How LDOO cuts those 30 minutes
LDOO isn't a dashboard. There's no template editor, no widget picker, no drag-and-drop builder. You ask a question in plain English:
"How did Verde Studio perform last month?"
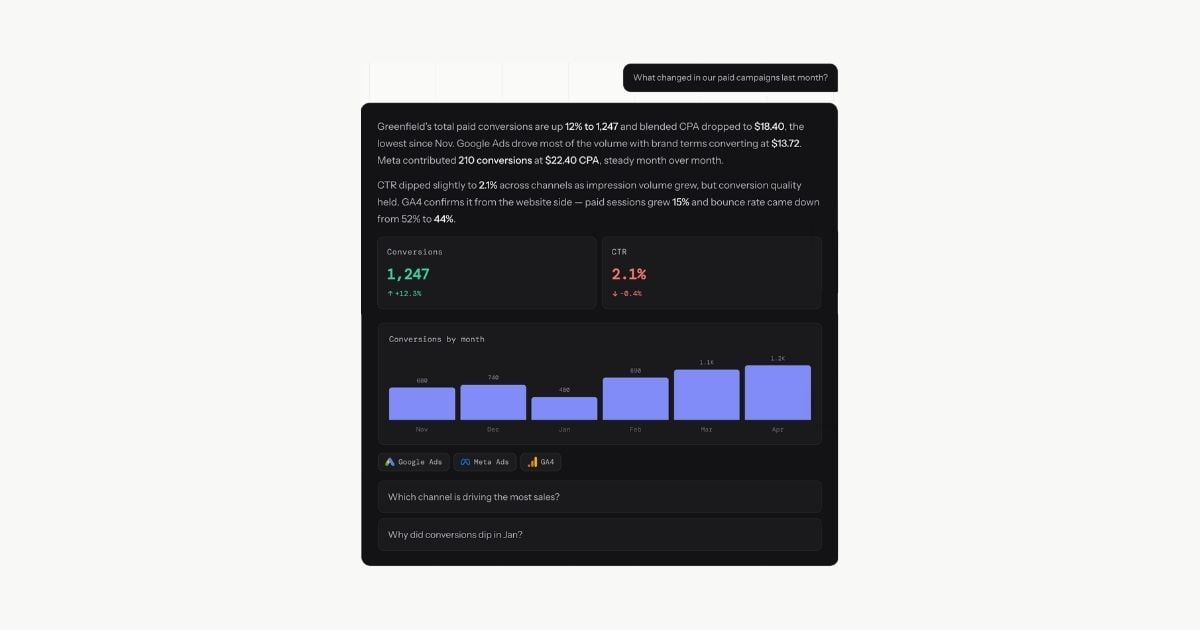
The answer comes back in about 30 seconds. Not a summary of charts — a specific explanation. LDOO connects to the same data sources you're already using — GA4, Google Search Console, Google Ads, Meta Ads, LinkedIn Ads, X Ads, YouTube Analytics, Shopify, Microsoft Clarity, HubSpot CRM, Google Sheets. It identifies what moved significantly, investigates the primary cause, compares against the prior period, and writes a client-ready explanation.
The output reads like an analyst wrote it:
Verde Studio's paid search revenue dropped 18% in March, from $42,300 to $34,700. The decline is concentrated in Brand Search campaigns, where CPA increased 31% starting March 14 — coinciding with a new competitor entering the auction. Conversion rate held steady at 4.2%, so this is an acquisition cost problem, not a landing page problem. Recommendation: Review bid strategy on Brand Search exact-match keywords to defend share against the new entrant.
From that single answer, you generate a branded PDF report — agency logo, colors, fonts applied automatically. Or share it as a live client portal: a branded page your client bookmarks, auto-updated with their latest data, no login required. Either output, under 60 seconds.
What happens after the first month
The first report saves 30 minutes. The second report is better than the first — because LDOO learns.
Client memory. LDOO remembers what it told you last month. When the March report flagged a CPA spike on Brand Search, the April report opens with whether that spike resolved, worsened, or stabilised. Dashboard tools start from zero every time you open them.
Cross-client pattern detection. When 4 of your 15 clients see Meta CPM spike in the same week, LDOO surfaces that as a portfolio-level pattern — not buried inside individual dashboards. You can also ask across your entire portfolio: "Which of my clients had the biggest CPA increase this month?" No dashboard answers that without opening each client individually.
Proactive alerts. When you open LDOO, it tells you which clients need attention — anomalies, baseline deviations, stale data. You don't scan 15 dashboards hoping to catch something. The system already caught it and shows you a one-sentence summary with a follow-up question pre-loaded.
Seasonal awareness. After 12 months of data, LDOO learns that this client's traffic dips every January and spikes every November. The January report says "traffic is down 15%, consistent with the seasonal pattern we've seen for the past two years" instead of flagging a false alarm. No dashboard remembers last January.
These features compound. Month 1, LDOO writes the report. Month 6, it writes the report and flags what changed since last month, correlates patterns across your portfolio, and tells you which clients need attention before you ask. That's the difference between a reporting tool and an analyst who lives on your data.
The same monthly report: AgencyAnalytics vs LDOO
Same client, same data sources, same deliverable. Here's how the workflow runs on each tool.
AgencyAnalytics:
- Open the Verde Studio dashboard (pre-built template, 30+ widgets)
- Scan for what moved — notice paid search revenue is down
- Click into the Google Ads widget, filter to last 30 days
- Drill into the Brand Search campaign — see CPA increased
- Check Search Terms and Auction Insights to identify the cause
- Switch back to the dashboard, open the report's text block
- Write the executive summary
- Write the recommendation
- Add next-month action items
- Export, send
Total time: ~30 minutes.
LDOO:
- Open LDOO, ask: "How did Verde Studio perform last month?"
- Read the explanation, verify the recommendation against your own judgment (~30 seconds)
- Click Doo a report — branded PDF generates in under 60 seconds
- Send
Total time: under 90 seconds. What's different is who writes the narrative.
AgencyAnalytics vs LDOO: full comparison
Automated reporting for clients — what that actually means
Most tools that claim automated client reporting automate the data pull, not the report. They schedule a dashboard email. The client opens it, sees charts, and replies: "So what does this mean?"
LDOO automates the full chain — from question to client inbox:
- Data query — pulls from connected sources automatically
- Anomaly detection — identifies what moved and by how much
- Cause investigation — drills into dimensions to find the driver
- Narrative generation — writes the explanation with specific numbers
- Recommendation — suggests the next action with estimated impact
- Branded output — PDF report or live client portal, white-labelled
- Scheduled delivery — auto-generates and emails on your cadence
The report arrives in the client's inbox fully written, fully branded, on schedule. Your account manager reviews it in 30 seconds instead of writing it in 30 minutes.
The pricing math
AgencyAnalytics charges per client. LDOO charges flat. Here's the same coverage on both:
| Clients | AgencyAnalytics | LDOO monthly | LDOO annual |
|---|---|---|---|
| 10 | $150–230/mo | $119/mo (Launch) | $99/mo |
| 20 | $300–460/mo | $239/mo (Growth) | $199/mo |
| 25 | $375–575/mo | $239/mo (Growth) | $199/mo |
| 50 | $750–1,150/mo | $399/mo (Scale) | $329/mo |
At 25 clients on annual billing, LDOO's Growth plan is roughly 50% cheaper than AgencyAnalytics on subscription alone.
But subscription isn't the big number. Time is. At an average agency billable rate of $100/hour, 10 hours of recovered reporting time is worth $1,000 per month — about five times the cost of the tool.
AgencyAnalytics competitors: same gap, different price points
AgencyAnalytics competitors fall into three buckets: cheaper dashboards (DashThis), premium dashboards (Whatagraph), and monitoring tools (Databox). Swydo ($69+/mo) is the closest like-for-like dashboard replacement with more flexible per-source pricing, but the narrative gap remains. Each tool in this set is genuinely good at what it does. None of them write the report.
DashThis alternative: the fastest setup in the category
DashThis ($33–499/mo by dashboard count) is the fastest setup in this category. Templates are pre-built for the most common agency stacks — connect data, pick a layout, send. For agencies with 5–10 clients on similar packages, you can have a polished dashboard in 20 minutes.
What DashThis doesn't do is explain what happened. The 30-minute narrative gap is identical. If you're evaluating DashThis alternatives, the question isn't whether the dashboards are good enough — they are. The question is whether you want to keep being the one writing the report.
Whatagraph alternative: the best-looking dashboards
Whatagraph ($199–999/mo) ships the best-looking dashboards in this category. The cross-channel widgets, the white-label polish, the data blending — among dashboard tools, it's the premium tier. Worth the money if visual fidelity is what you're selling.
The 30 minutes is still 30 minutes. Whatagraph's higher price reflects production value on the dashboard, not interpretation of the data. If you're paying $500/mo for Whatagraph and still writing the executive summary by hand, the bottleneck isn't your tool budget — it's the category.
Databox alternative: monitoring, not reporting
Databox ($47–799/mo) is in a slightly different category — it's monitoring, not reporting. Real-time KPI dashboards, TV displays, mobile apps, push alerts when a metric crosses a threshold. For in-month tracking, it's a strong tool.
But when the month ends and the report needs to go to the client, the same gap appears. When the client asks "why did organic traffic drop?", Databox shows the number dropped. It doesn't tell you the decline is concentrated on three high-traffic landing pages that lost top-3 rankings on March 14, when a competitor published a fresher version of the topic. That answer requires either 30 minutes of investigation, or an AI built for it.
Looker Studio agency reporting: free, but you build everything
Looker Studio is free, which makes it the default starting point for many agencies. The cost is in the build: every dashboard from scratch, every data source connected manually, every report blank-page-styled. For agencies considering Looker Studio for agency reporting, the calculation isn't dashboard vs dashboard. It's whether you can absorb the build time on top of the 30 minutes of narrative writing — and whether the output looks like a deliverable your clients will pay for.
When AgencyAnalytics is still the right tool
LDOO isn't always the answer. AgencyAnalytics is the right choice if:
- Your clients want always-on dashboard access — logged-in, interactive, refresh-on-demand
- You report on niche data sources outside the 11 core marketing platforms
- You sell dashboards as the deliverable, not reports
- Your clients pay specifically for dashboard branding and interactivity
LDOO is the answer if:
- You or your account managers personally write the monthly report narrative
- Clients value explanations and recommendations over raw access
- You're hiring (or want to avoid hiring) just to keep up with reporting volume
- You want flat-rate pricing that doesn't penalize you for winning more clients
- You want the AI to get smarter about each client over time, not start from scratch every month
Switching: what it actually takes
LDOO connects to your data sources via OAuth — the same GA4, Google Ads, and Meta Ads accounts you've already connected to AgencyAnalytics. No data migration. No template rebuild. No team retraining.
Start free with one client — no credit card, no time limit:
- Sign up
- Connect one data source
- Add a client
- Ask your first question
- Generate your first report
Compare what LDOO produces to the report your team wrote manually last month. If LDOO's version matches or beats it, the 30 minutes per client comes back immediately.
You don't have to cancel AgencyAnalytics on day one. Many agencies run both for a month — AgencyAnalytics for the live dashboards their clients already have access to, LDOO for the monthly report. You'll know within one reporting cycle whether to consolidate.
Frequently asked questions
Which is the best AgencyAnalytics alternative for my agency?
If the bottleneck is the 30 minutes per client spent writing the report narrative, LDOO is the answer — it's the only tool in this set that writes the explanation, not just the dashboard. If you just want a cheaper dashboard with faster setup, DashThis. Premium visual quality, Whatagraph. Real-time monitoring with alerts, Databox. Zero subscription cost and technical bandwidth to build, Looker Studio.
How do I know the AI is right?
Every LDOO answer shows the underlying data: the exact query, the date range, the comparison source. You can drill into any number to see how it was calculated. Most agencies spot-check the first month against their own analysis, then trust the workflow. Senior review takes 30 seconds per report — verifying the AI's conclusion — instead of 30 minutes writing it from scratch.
Does LDOO actually automate client reporting end-to-end?
Yes. The full chain — data query, anomaly detection, cause investigation, narrative writing, recommendation generation, branded PDF or live portal output, scheduled email delivery — runs without manual steps. The senior time you currently spend on automated client reporting workflows that aren't actually automated is exactly what LDOO eliminates.
Is LDOO a replacement for AgencyAnalytics?
For the monthly client report workflow, yes. LDOO generates the report AgencyAnalytics can't: one with a written narrative, specific recommendations, and contextual memory of what happened last month. The exceptions are agencies that need niche data source coverage outside LDOO's 11 core platforms, or clients who specifically want logged-in dashboard access.
How does LDOO pricing compare to AgencyAnalytics?
AgencyAnalytics charges $15–23 per client per month. LDOO charges flat: $119/mo for 10 clients (Launch), $239/mo for 25 clients (Growth), $399/mo for 50 clients (Scale). Annual billing saves roughly two months. At 25 clients on annual billing, LDOO is approximately 50% cheaper on subscription alone — before the recovered reporting time.
How does AgencyAnalytics compare to Raven Tools, RankTracker, and other agency reporting tools?
The competitive landscape splits along the same line. Raven Tools, RankTracker, and AgencyAnalytics are dashboard-and-reporting platforms with overlapping feature sets — each has integration coverage, white-label, scheduled reports. Choosing between them is a question of which integrations you need and what you're willing to pay per client. None of them write the narrative. LDOO is in a different category: conversational analytics, where the AI answers the question and writes the report instead of building a dashboard for you to interpret.
Can LDOO connect to the same data sources I use today?
LDOO connects to 11 core marketing platforms via OAuth: GA4, Google Search Console, Google Ads, Meta Ads, LinkedIn Ads, X Ads, YouTube Analytics, Shopify, Microsoft Clarity, HubSpot CRM, and Google Sheets. These cover the majority of agency client stacks.
Does LDOO remember previous reports?
Yes. LDOO maintains client memory across conversations and reports. The April report references March's recommendations. If you flagged a CPA issue last month, this month's report opens with whether it resolved. Dashboard tools have no memory — every session starts from zero.
Are LDOO reports white-labeled?
Yes. Your agency's logo, colors, and fonts are applied automatically to every report and client portal. Clients see your brand, not ours.
Can I see a demo before signing up?
Yes. Watch a demo to see the full workflow: question, explanation, report generation, and client portal — in under 2 minutes.