Your agency already has the data. Google Ads, Meta, GA4, Search Console, Shopify — the numbers are there. The bottleneck is what happens after: interpreting those numbers, writing the explanation, formatting the report, and getting it to the client. That step takes 20–60 minutes per client per month. For a 20-client agency, that is 7–20 hours a month of skilled work that is not strategy.
LDOO (pronounced el-doo) removes that step. Connect your data sources, ask a question in plain English, and get a specific, numbers-backed explanation you can send to a client without editing. From that answer, generate a branded report, create a live client portal, or set up an alert — all from the same conversation.
The name stands for Live Data, Organized Outcomes. The product hierarchy is straightforward: Ask → Explain → Share.
What conversational analytics actually means
Conversational analytics is a category where the primary interface is a question, not a dashboard. You type what you want to know. The platform returns a written explanation with specific numbers, causes, comparisons, and a recommendation.
The distinction is not cosmetic. Dashboards show data. Conversational analytics explains it. When an agency account manager needs to tell a client why ROAS dropped last week, the answer should be a paragraph they can paste into an email — not a screenshot of a line chart that the client has to interpret themselves.
LDOO includes charts and tables where they add clarity. But the primary output is always a written explanation, because that is what clients and stakeholders actually read.
For a deeper treatment of the category, see the conversational analytics glossary.
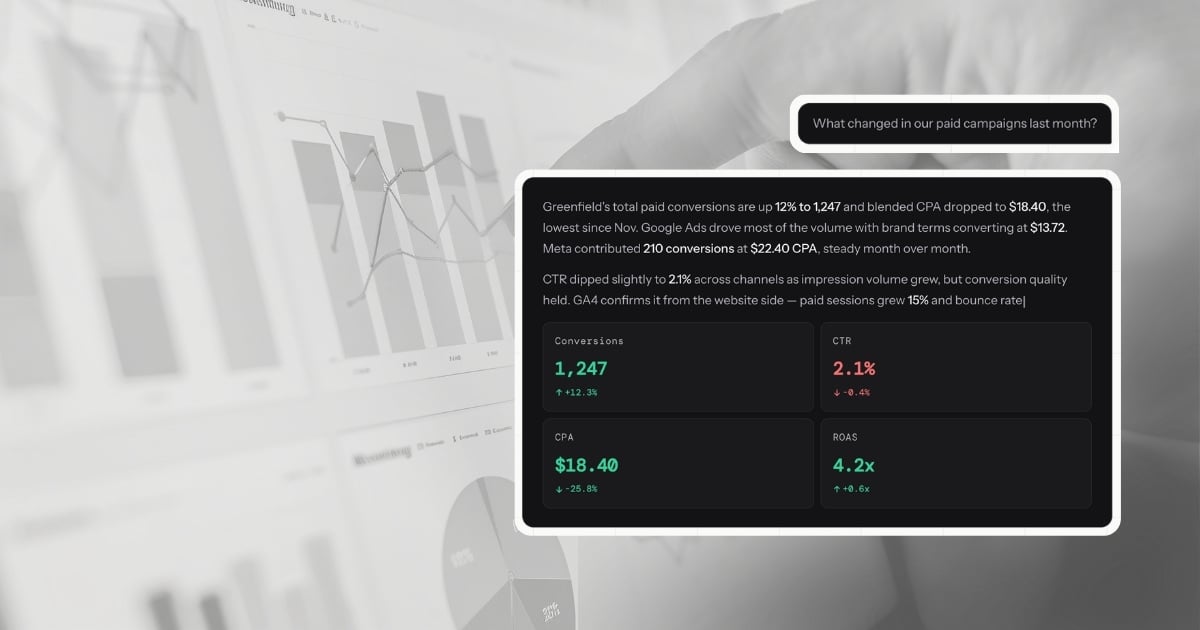
Ask a question. Get a real answer.
Type "What changed this week for Verde Studio?" or "Which campaigns had the highest CPA last month?" and LDOO returns an answer with:
- A specific number — not "revenue declined" but "revenue declined 12%"
- A primary cause — the single most likely driver, stated directly
- A comparison anchor — against the prior period, a baseline, or a target
- An actionable recommendation — what this means for the next decision
Every answer includes source attribution. You see exactly which platform the data came from and how fresh it is. If the answer draws from cached data, the freshness badge tells you.
The bar is simple: would an agency account manager send this to a client without editing? If no, the answer has failed.
Answers that get smarter over time
LDOO is not a stateless query tool. Every conversation builds context:
- 90-day baselines — LDOO computes statistical normals per metric per client, so it knows what "normal" looks like and flags deviations automatically
- Conversation memory — follow-up questions carry context from previous answers, and insights from earlier conversations inform future ones
- Client goals — industry, primary KPI, targets, and seasonality notes shape how LDOO interprets performance
- Dimensional investigation — when a metric moves significantly, LDOO automatically breaks down the change by campaign, device, region, and channel to find the root cause
The result: the tenth question about a client is sharper than the first. The answer references what changed relative to what is normal for this specific client, not just a generic period-over-period comparison.
Cross-client intelligence
Select "All clients" and ask "Which client had the biggest spend increase this week?" or "Who needs attention?" to get an account-wide view. One question, every client, ranked by what matters.
Generate branded reports in under 60 seconds
From any answer, generate a full client report with one click. The report includes:
- An AI-written executive summary grounded in the actual data
- KPI comparisons with period-over-period changes and baseline context
- Campaign performance tables with status indicators and efficiency metrics
- Channel breakdowns per connected source
- Prioritised recommendations with estimated impact
Reports are white-labelled. Your agency logo, colours, and fonts are applied automatically. LDOO appears only as a subtle "Powered by" footer. The client sees your brand.
Scheduled delivery means a report regenerates and emails to a list of recipients every Monday morning without anyone touching it. The content updates because it queries live data each time. Each section can be individually regenerated or edited — the executive summary can be re-emphasised, the campaign table reordered, the recommendations sharpened.
For a closer look at the report pipeline, see the reports feature page.
Create live client portals from a single sentence
Client portals are branded, live data views that clients access via a link. No LDOO account required. No login unless you set a password. The client sees KPIs, charts, and tables that update with each data sync, branded entirely with your agency identity.
Creating a portal takes one step: ask a question about a client, then click "Create portal." LDOO generates the layout based on the client's connected integrations — KPI tiles, trend charts, campaign tables, channel breakdowns. The portal is live immediately. Copy the link, send it to the client.
There is no drag-and-drop builder, no widget picker, no configuration screen. The layout is generated from the data. The client sees exactly what you want them to see.
Portal management lives on the portal hub: view counts, last-viewed timestamps, password management, and revocation. A first-view alert notifies you when a client opens their portal for the first time.
Learn more on the portals feature page.
Know before your client asks
After each data sync, LDOO runs detection checks across all connected clients: CPA anomalies, conversion drops, spend pacing issues, ROAS threshold breaches, and opportunity signals. Detected alerts appear within 60 seconds of a sync completing with the specific numbers, the affected client and campaign, and a one-click path to investigate.
If CPA spiked 45% on a client's top campaign overnight, you find out before the client does.
You can also set custom alert rules in conversation: "Tell me when CPA exceeds $50 on Verde Studio's Google Ads." LDOO saves the rule and evaluates it after every sync — no settings page, no configuration form.
Who LDOO is built for
Marketing agencies (primary)
Agencies with 8–20 employees managing 12–25 active client accounts. Every product decision is tested against this profile.
The specific problem: most agencies already have a reporting tool (AgencyAnalytics, DashThis, Looker Studio). They can pull the numbers. What takes time is the narrative explanation — why ROAS changed, what drove the conversion spike, which campaigns should get more budget. That writing step takes 20–60 minutes per client per month. Multiply by 20 clients and you have a full-time job that is not strategy.
LDOO removes that step. The answer is already written in the voice and specificity of a senior analyst. The report is already branded. The portal is already live. The time between "I need to update the client" and "The client has been updated" drops from an hour to two minutes.
LDOO is compatible with existing reporting tools. An agency can keep AgencyAnalytics for dashboard access and use LDOO for the intelligence and narrative layer. There is no switching cost — LDOO replaces the work you do after the dashboard, not the dashboard itself.
In-house growth teams (secondary)
In-house marketing teams use LDOO with a workspace model instead of a multi-client model. Same capabilities: ask questions, generate reports, create portals for internal stakeholders, get alerts. Pricing is on a separate in-house track.
How the pipeline works
Five stages from question to answer:
Plan. Your question is analysed to determine what data is needed, which sources to query, and what time range to cover. The planner generates a structured query plan — not raw SQL.
Fetch. Data is retrieved from live platform APIs (GA4, Search Console, Google Ads, Meta, Shopify) or from the synced data store, depending on freshness and API quota. If live data is available, it is used. If quotas are exhausted, the system falls back to synced data and tells you.
Interpret. The data is interpreted into a natural language answer with specific numbers, comparisons, and actionable findings. The interpretation runs with context from previous conversations, 90-day baselines, recent alerts, report insights, client goals, and feedback from past answers.
Verify. A separate verification pass checks the answer against the underlying data — a distinct model call that catches hallucinations, arithmetic errors, and unsupported claims.
Deliver. The answer streams to your screen in real time with source attribution, a freshness badge, and follow-up suggestions. From there: generate a report, create a portal, save the insight, set up an alert, or ask a follow-up.
For a detailed walkthrough, see how LDOO works.
11 connected data sources
Each connection uses read-only OAuth access. One click per source.
- Google Analytics 4 — sessions, users, page views, bounce rate, average session duration, source/medium breakdowns
- Google Ads — campaign, ad group, and keyword performance: spend, conversions, CPA, ROAS, impression share
- Meta Ads — campaign and ad set metrics across Facebook and Instagram: spend, reach, conversions, cost per result
- Google Search Console — organic queries, clicks, impressions, CTR, average position, page-level performance
- LinkedIn Ads — campaign performance with B2B demographic breakdowns by job title, seniority, company size, industry
- X Ads — campaign engagement, CPC, conversions, video views, audience performance
- HubSpot CRM — contacts, deals, pipeline, lead source attribution, deal revenue, close rates
- Shopify — orders, revenue, average order value, product performance, real-time webhook updates
- YouTube Analytics — views, watch time, subscribers, engagement metrics
- Google Sheets — custom data imports for KPIs, budget trackers, and offline metrics
- Microsoft Clarity — behavioural signals: dead clicks, rage clicks, scroll depth, session insights
All sources are normalised into a unified schema on sync. Cross-platform questions — "Which channel drove the most conversions last month?" — draw from every connected source and compare them directly. You do not specify which platform to query.
Pricing
Two tracks, both with a free plan. No credit card required.
Agency: Free (1 client, 30 questions/month) → Launch ($99/month annual, 10 clients, 300 questions) → Growth ($199/month annual, 25 clients, 750 questions) → Scale ($329/month annual, 50 clients, 1,500 questions). Extra clients: $12/client/month ($10 on Scale). White-label reports from Launch, scheduled delivery and custom domains from Growth, per-client branding and bulk generation on Scale.
In-house: Free → Pro ($99/month annual, 5 workspaces, 500 questions) → Elite ($199/month annual, unlimited workspaces, 1,500 questions).
The pattern: 30 questions per client per month at every paid tier. Questions are pooled across clients — ask 50 about one client and 10 about another. The quota grows as you add clients.
Most reporting tools charge $15–23 per client per month. At 25 clients, that is $375–575/month — and you still write the explanation yourself. LDOO starts at $99/month flat and writes the explanation for you.
Full plan details on the pricing page.
What LDOO replaces in your stack
Most agencies arrive from one of three places:
AgencyAnalytics or DashThis for dashboards, writing the narrative section manually. LDOO replaces the writing step. Keep the dashboard if you want it — LDOO handles the intelligence layer.
Looker Studio with hours spent on connector maintenance, permission issues, and report formatting. LDOO connects via OAuth in one click, formats automatically, and does not break when Google changes an API.
ChatGPT with CSV uploads, hitting the limits of stale data, hallucinated numbers, and no branded output. LDOO connects to live APIs, verifies every number against the source data, and produces branded PDFs and portals — not chat messages you have to copy into a Google Doc.
LDOO replaces the explanation layer, not the ad platform or the CRM. You keep Google Ads, Meta, GA4, Shopify. LDOO connects to them and does the part your team currently does manually: interpret the data, write the summary, format the report. The integrations are live. The output goes directly into a branded PDF or a client-facing portal without reformatting.
Get started in under 5 minutes
Sign up, connect your first data source via OAuth, and ask your first question. From that first answer, generate a report, create a client portal, or set up an alert. The entire workflow that takes an hour on other platforms happens in under two minutes.
Start free — no credit card required.