Report week used to mean a week. Now it’s a morning.
Asked & Answered is a monthly note from LDOO: what shipped, why it matters, and one idea you can use this week.
In this issue
- Report day: last month’s client reports, built on the 3rd and sorted by what each needs from you.
- Every claim checked against the numbers behind it: a sentence the report’s own figures can’t support never reaches you.
- Bring the reports you already send: upload a few PDFs from AgencyAnalytics, Looker Studio, DashThis or wherever you build them, and LDOO follows their structure, in your words.
- Shape any report your way: add a section in plain English, drag to reorder, cut, or write your own line under a figure.
One queue for the whole month
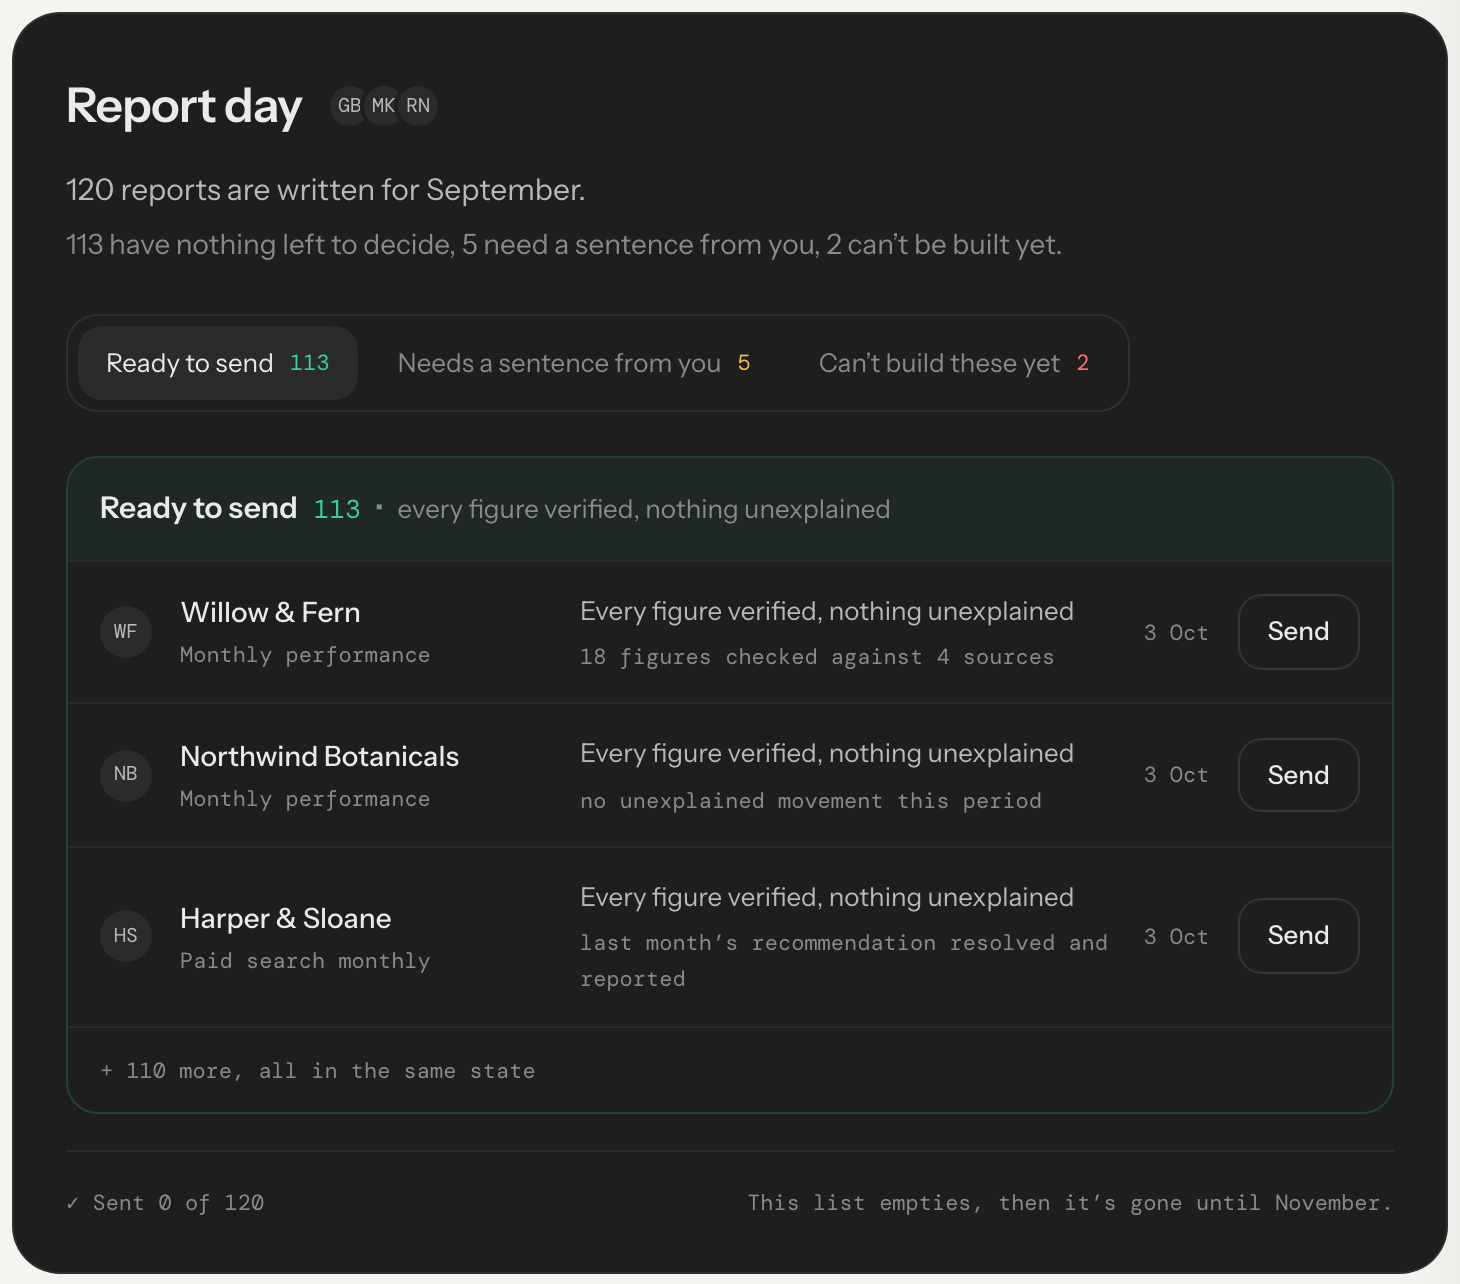
What changed. On the 3rd, LDOO builds every client’s report for the month that just closed, each from that client’s own questions, and sorts them into piles. Ready to send: every figure verified. Needs a sentence from you: a number moved and the data doesn’t say why, so answer in one line and LDOO writes it in and remembers it for that client next month. Waiting on data: the few that can’t finish yet.
Why it matters. Report week becomes a morning of reading, not writing. You open the reports that need you and send the rest straight from the list.
“LDOO makes it much easier to turn performance data into clear, professional client reports … rather than simply overwhelming them with dashboards and raw numbers.”
Martin Beeson, Agency Owner, Growth Affect CRO. Verified review on Capterra
What else changed
Every claim checked against the numbers behind it
Before a report reaches you, a second model reads each section against a sheet of that report’s own figures: every number, which channel or campaign gets the credit, which way each metric moved, and any cause the report names. A claim the data contradicts or can’t support is corrected from the figures, and cut if it can’t be. It never ships.
Why it matters: Send every report with confidence, without checking each figure against the dashboard first.
Bring the reports you already send
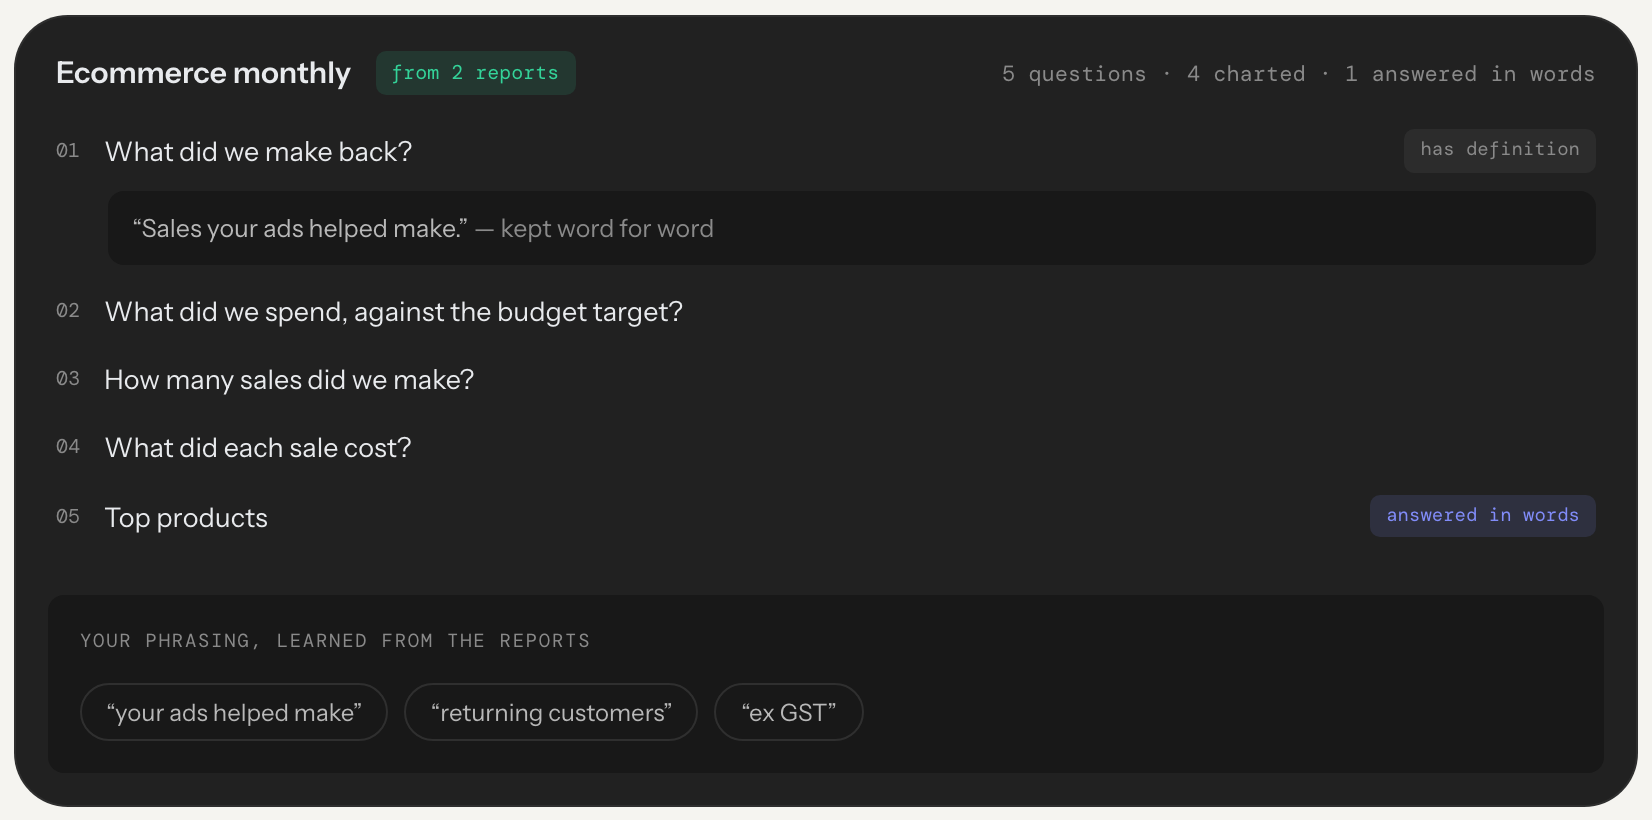
On Reports, choose Set up from an existing report and upload up to eight of your current reports as PDFs. LDOO reads the questions out of them: every metric and your definition of it, budget targets, extra sections like locations or search terms, and your sign-off. Reports with the same layout become one question set, in your wording, and nothing is saved until you choose Use these.
Why it matters: Clients keep the report they already know, without you rebuilding it.
A report builder that bends to the client
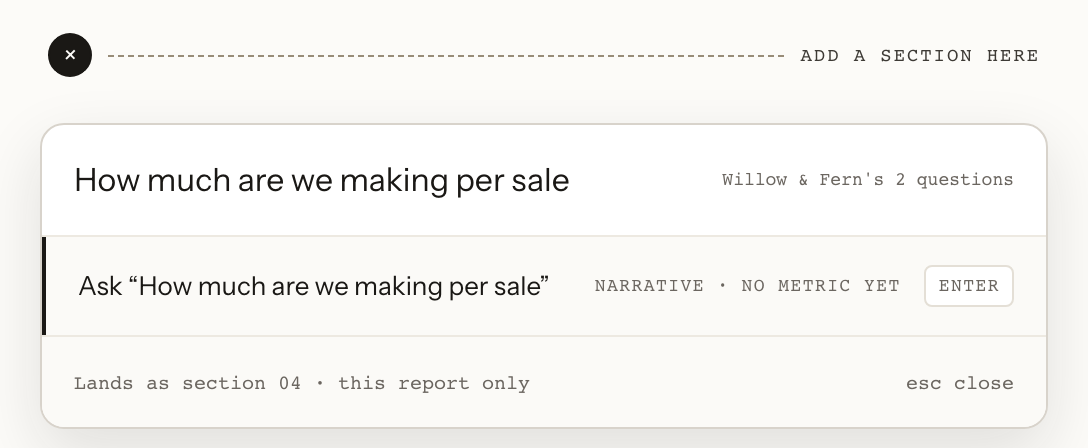
Hover between two sections to add one: pick a standing question or type your own, like “how much are we making per sale”, and LDOO charts it when the data allows. Drag sections in the contents to reorder them, cut one for this month or for good, and add your own sentence under any figure with Write it in. Select any sentence to rewrite or shorten it.
Why it matters: Change it once, for this month or for good.
Reports that know the client
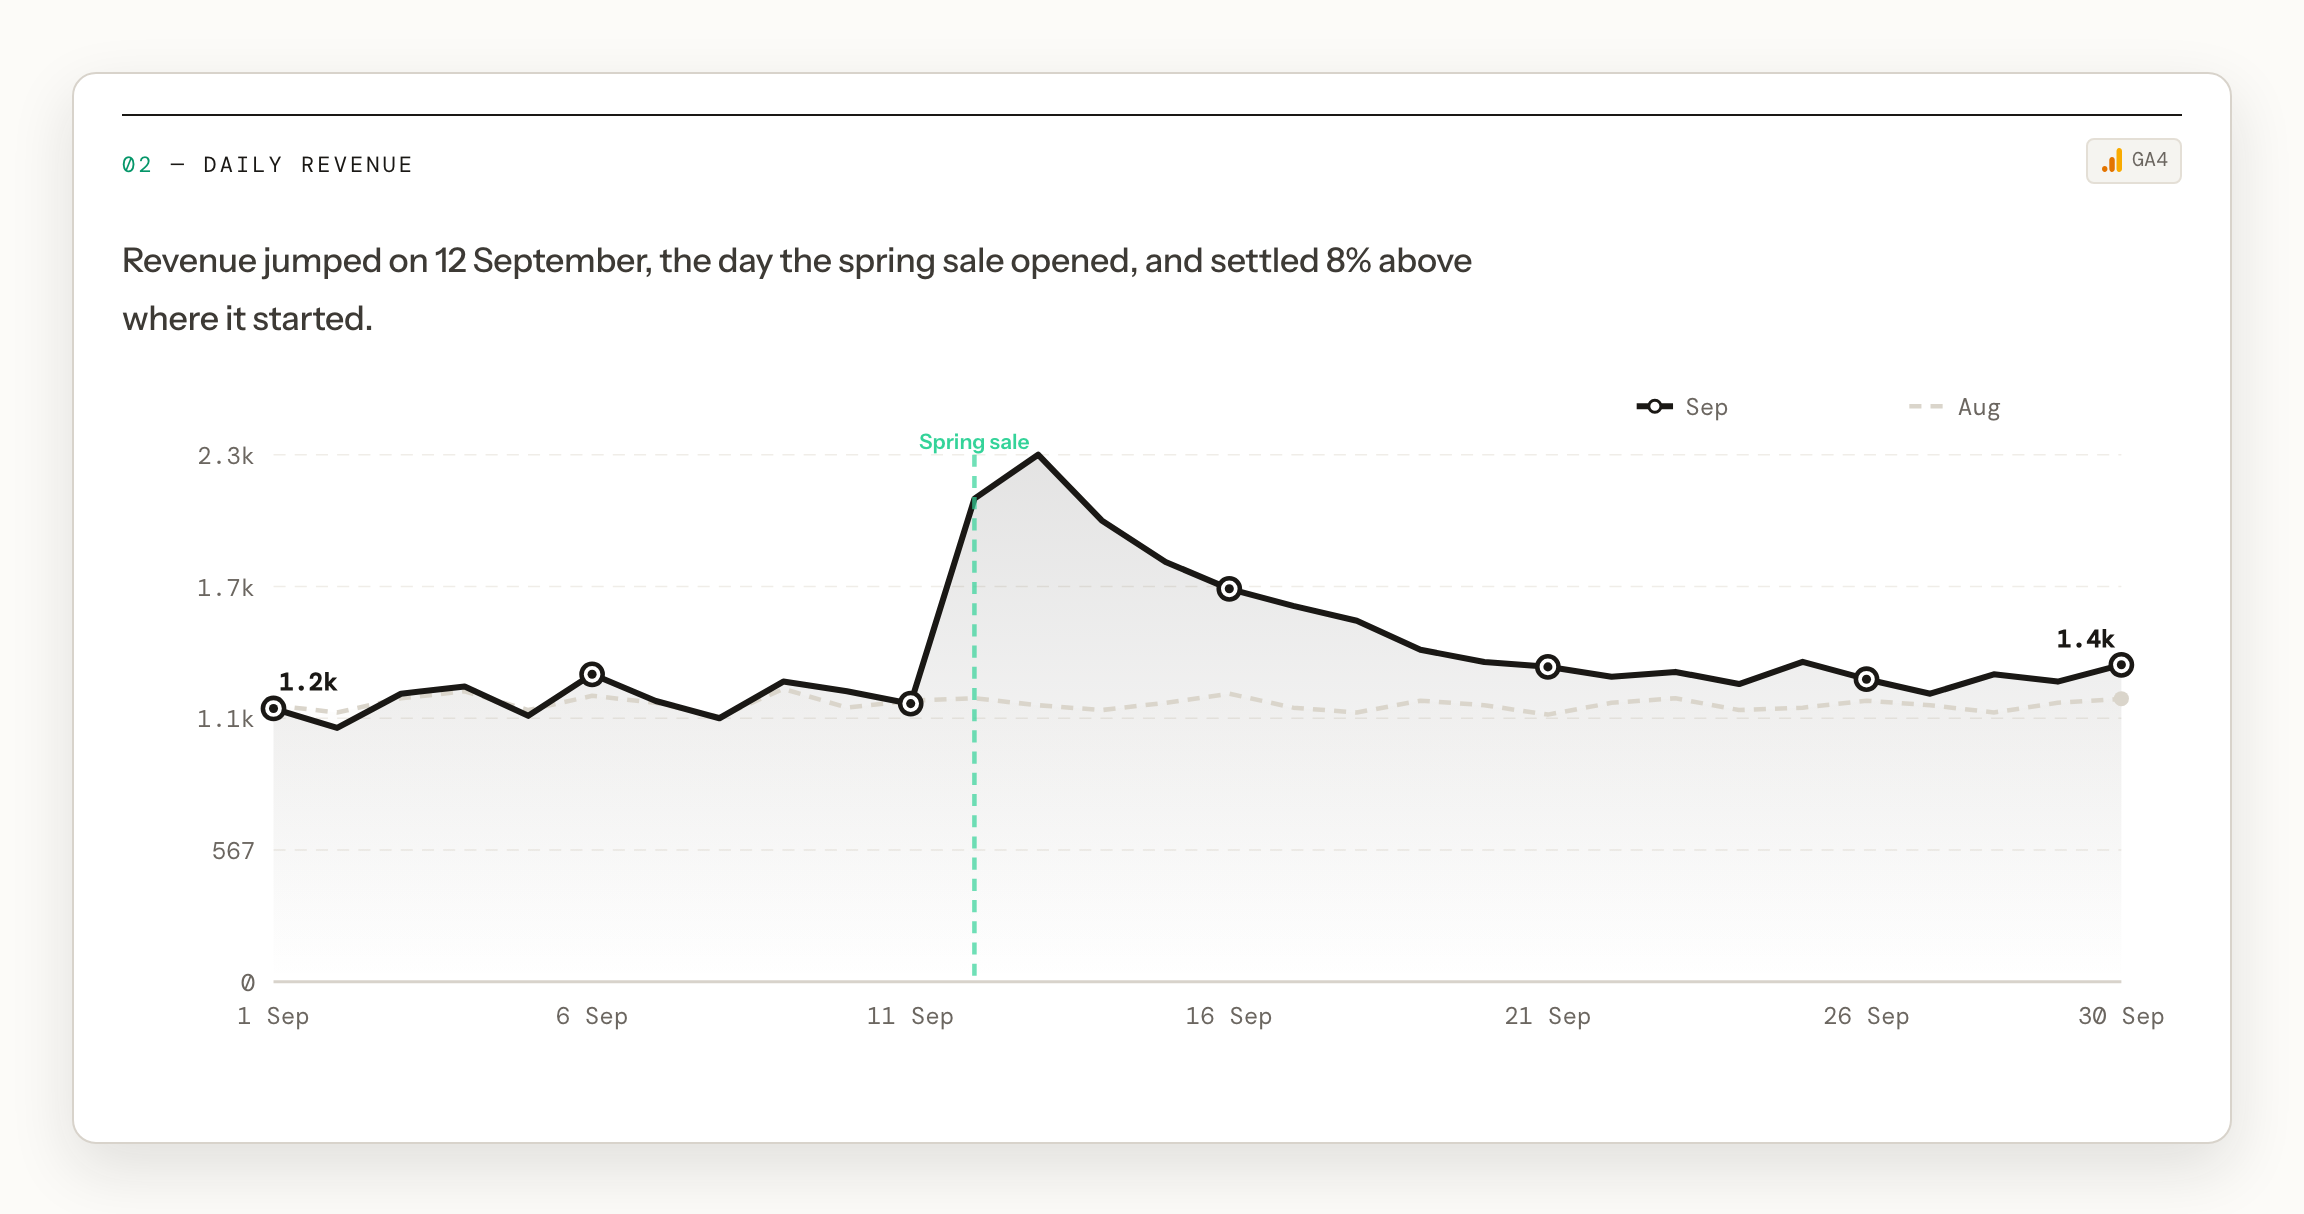
Reports now read what LDOO knows about each client: your notes, goals and the dated events you mention in chat, like a launch or a promotion. Confirmed events are marked on the charts, so a spike arrives with its reason.
Why it matters: Commentary that sounds like it came from the person who runs the account.
Next: Reports that read how an account is set up, from bid strategies to conversion actions, not only what it spent.
Reporting idea
| Source | Conversions | Counted by |
|---|---|---|
| GA4 | 38 | by day it happened |
| Google Ads | 51 | by day of the click |
An example month.
Both are right.
Google Ads credits a conversion to the day of the ad click, while GA4 usually shows it on the day it happened. Google Ads only counts conversions from its own clicks, the two can use different attribution settings, and consent banners and cross-device journeys widen the gap.
LDOO’s reports handle this for you. They compare sources over the days both cover, and when a Google Ads conversion action does need attention, they name it and say what to change.
Don't try to make the numbers match. Tell the client up front which number you report on and why, and they will stop asking.
Ask LDOO: “Why do GA4 and Google Ads show different conversion numbers for [client] this month?”
Built by someone who wrote these reports
I built LDOO after years of explaining a paid social result to a client at 5pm on a Thursday, and defending last quarter's numbers to a CFO at 9am on a Monday. If a report still needs rewriting before it goes out, I want to know which part.
Tell me which part you still rewrite: the commentary, the numbers, the layout, or email me. I read every message.
— Gideon Banks, Founder, LDOO, Christchurch